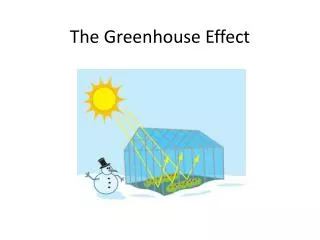
The Greenhouse Effect
National Aeronautics and Space Administration. The Greenhouse Effect. Dr. Lin H. Chambers, NASA Langley Research Center Hampton, Virginia NASA Climate Day Workshop , Oct. 2011. www.nasa.gov . The Electromagnetic Spectrum. http://mynasadata.larc.nasa.gov/ElectroMag.html.

The Greenhouse Effect
E N D
Presentation Transcript
National Aeronautics and Space Administration The Greenhouse Effect Dr. Lin H. Chambers, NASA Langley Research Center Hampton, Virginia NASA Climate Day Workshop, Oct. 2011 www.nasa.gov
The Electromagnetic Spectrum http://mynasadata.larc.nasa.gov/ElectroMag.html
The Blackbody Spectrum – The Sun http://phet.colorado.edu/simulations/sims.php?sim=Blackbody_Spectrum
The Blackbody Spectrum – Light Bulb http://phet.colorado.edu/simulations/sims.php?sim=Blackbody_Spectrum
The Blackbody Spectrum – Light Bulb Note Scale Change! http://phet.colorado.edu/simulations/sims.php?sim=Blackbody_Spectrum
The Electromagnetic Spectrum Peak of Earth emission ~10 mm = 104 nm http://radiojove.gsfc.nasa.gov/education/educ/radio/tran-rec/exerc/iono.htm
The Earth’s Energy Budget http://mynasadata.larc.nasa.gov/preview_lesson.php?&passid=63
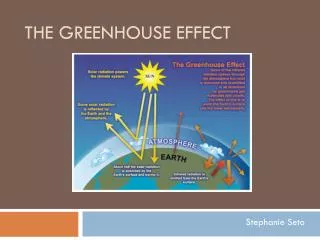
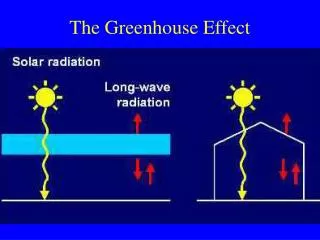
Balancing the Budget - I At the top of the atmosphere: + Sunlight In – Sunlight reflected from clouds/atmosphere – Sunlight reflected from surface – IR emission 0 Equilibrium Temperature: -18 °C http://mynasadata.larc.nasa.gov/preview_lesson.php?&passid=44
At the Earth’s surface: + Sunlight absorbed – IR emission + IR back radiation (greenhouse effect) – Thermals – Evapotranspiration 0 Balancing the Budget - II Equilibrium Temperature: 15 °C http://mynasadata.larc.nasa.gov/preview_lesson.php?&passid=63 http://mynasadata.larc.nasa.gov/preview_lesson.php?&passid=67
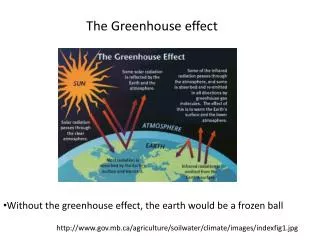
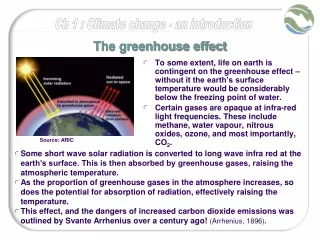
The Enhanced Greenhouse Effect Starting point: Earth at equilibrium with net energy input from the Sun. Average surface temperature 288 K (15 C; ~59 F)
The Enhanced Greenhouse Effect The experiment: Instantaneously double CO2 in concentration in atmosphere Average energy emitted by Earth drops 4 W/m2 (236 vs 240)
The Enhanced Greenhouse Effect Response: All other things being equal, simple blackbody theory says: Average surface temperature rises 1.2 K (or C; ~2.1 F) Energy back in balance
The Enhanced Greenhouse Effect Feedbacks: In Earth system, other processes kick in (water vapor feedback, cloud feedback, ice-albedo feedback, etc). Net effect: Average surface temperature estimated to rise 2-4.5 K (~3.6 to 8 F)
Forcings on the Greenhouse http://ipcc.ch/publications_and_data/ar4/wg1/en/figure-spm-2.html
Energy Balance analysis • This figure depicts mostly positive and long-lived forcing agents from 1950 through 2004. The positive forcing agents are items that cause the atmosphere to show an overall warming trend because they trap additional energy in the atmosphere (enhanced greenhouse effect). The greenhouse gasses shown in the figure (carbon dioxide - CO2, methane - CH4, halocarbons, nitrous oxide - N2O and stratospheric + tropospheric ozone - O3) have increased in the atmosphere mostly due to human activities. A natural change from variations in the Sun’s output is shown along the bottom of the graph This figure shows the cumulative effect of small changes. The additional heat trapped each year continues to add up to a warmer Earth. http://science-edu.larc.nasa.gov/energy_budget/ Physics of Our Atmosphere
Where did the Energy Go? • Knowing how much additional heat is trapped (because we know how much of these gasses were emitted) the question becomes: where did the energy go? This figure partitions the added energy shown above based on observed changes. So far, a small amount of the energy has gone into warming the ocean – the part of the Earth that stores the most energy. Some has escaped Earth in the form of increased IR emission because of warmer temperatures. Some was reflected to space by aerosols (mostly volcanic in origin) in the stratosphere. The remainder (white band) is inferred to have been rejected due to aerosols (mostly pollution) in the troposphere, and other effects such as a changing reflection of the land surface due to deforestation, for example. http://science-edu.larc.nasa.gov/energy_budget/ Physics of Our Atmosphere
Interactive Applet http://profhorn.meteor.wisc.edu/wxwise/climate/makeplanet.html
SignOffPage MY NASA DATA: A REASoN Project