The Greenhouse Effect
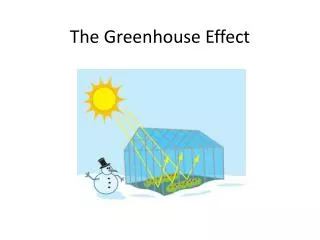
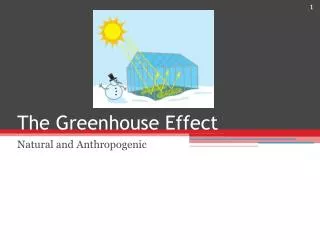
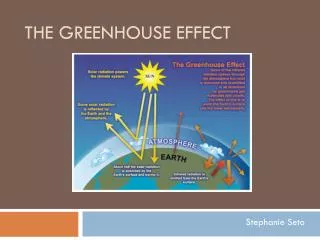
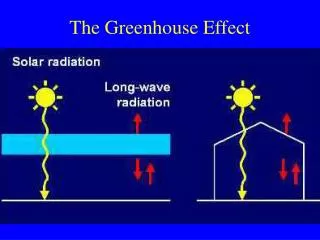
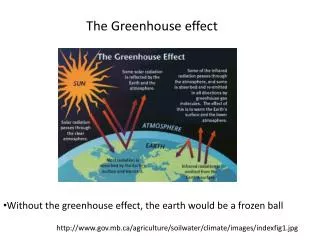
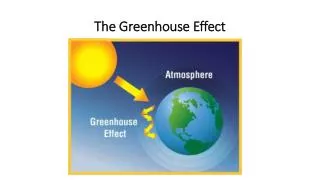
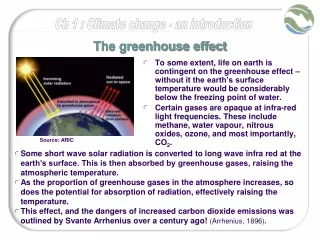
The Greenhouse Effect. The Greenhouse Effect. Natural process – Earth’s surface absorbs infrared radiation from Sun. Gases and clouds in the atmosphere trap this energy and radiate it back in all directions. This makes Earth’s avg. temp about +15 o C

The Greenhouse Effect
E N D
Presentation Transcript
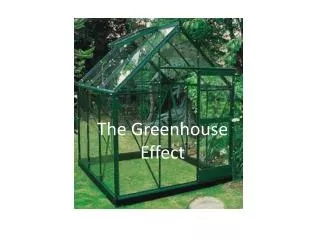
The Greenhouse Effect • Natural process – Earth’s surface absorbs infrared radiation from Sun. Gases and clouds in the atmosphere trap this energy and radiate it back in all directions. • This makes Earth’s avg. temp about +15oC • Without the Greenhouse effect, the Earth would have an avg. temp of -18oC
Some terms: Parts per million (ppm) – a measurement of the concentration of gas (also ppb, and ppt) Anthropogenic – resulting from human influence Pre-Industrial – before the 1800’s Industrial Age
Earth’s Atmosphere • Earth’s Atmosphere: N2: 78.08% O2: 20.95% Ar: .93% Trace Gases: 0.04%
Greenhouse Gases • Most atmospheric gases do not absorb radiation (N2, O2, Ar, H2, Ne, Kr) • Some gases do, called greenhouse gases (GHG’s): H2O CO2 CH4 O3 N2O
Water Vapour (H2O(g)) • Concentration in atmosphere depends on temp. • Causes 2/3 of greenhouse effect • Feedback loop: • The warmer the air, the more water vapour the air can hold • The more water vapour the air can hold, the warmer it gets
Carbon Dioxide (CO2) • CO2 concentration is 385ppm • 0.0385% of Earth’s atmosphere • Before the Industrial age, it was 280ppm • Causes ¼ of greenhouse effect
Carbon Source or Sink? • Oceans & healthy forests are carbon sinks – remove C from atmosphere and store it in different forms (i.e. C6H12O6) • Damaged forests (insect, fires, deforestation) are carbon sources – speed up decomposition and CO2 emissions *not necessarily more is released… just faster rate since trees will eventually die
Methane (CH4) • Very efficient at absorbing radiation (23x more powerful than CO2) • Pre-industrial concentration was 0.700ppm • Modern concentration is 1.785ppm (2.55x higher)
Relationship between CO2 and Temperature Do the temperature and CO2 lines look similar? Let’s overlap the two lines to make sure.
Ozone (O3) • Ozone exists naturally in the stratosphere (20-60km up), and protects against UV • Ozone in troposphere (0-20km up) is a GHG • Causes smog in cities
UV index: a Canadian invention • A scale that tells us how much time in the Sun would cause sunburn on a specific day
Nitrous Oxide (N2O) • 300x more effective at absorbing energy than CO2 • Pre-industrial concentration was 270 ppb • Modern concentration of 321 ppb (1.2x more)
GHG’s Ranking Activity Sources of Anthropogenic GHG’s
Most Sources of GHG’s Second Most Middle Middle Middle • Work in groups of 3 or 4 (your teacher will assign your groups) • Get a package of pictures from your teacher • Look over the pictures, and read the captions, and rank them according to which you think will be the greatest and least sources of GHGs • Arrange your rankings according to the diagram to the right. Least Least
Walkabout • Walk around to other groups, and compare your results to others • Copy the following chart into your notes:
Canada’s Emissions (in megatonnes per year CO2 equivalent) 324 Producing and Using Energy Transportation 190 20 67 54 21 62 Fugitive Emissions Pg. 390 Waste Management Industrial Processes Agriculture Land use and Forestry
Solutions Brainstorming • To limit the effects of climate change we need to limit the gases we are emitting, because it is these gases that are causing climate change • In the last two columns of your table, brainstorm solutions for each source. • Organize your solutions by individual, or govt/business • Individual solutions are things that all of us can do, likely starting today • Govt/Business solutions are those that require the cooperation of governments, and/or businesses and other institutions
Who Cares? • Why should we worry about the greenhouse effect? • Wouldn’t it be great is Canadian winters were warmer, and summers longer?
Temperature Change Data 1880-1884
1880-1884 1886-1890
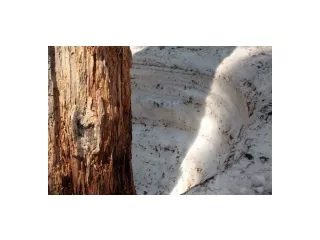
Ice on Kilimanjaro 15 ) 2 10 Area (km 5 0 1900 1920 1940 1960 1980 2000 2020 Year Kilimanjaro 2000