Download
1 / 34
340 likes | 353 Views
Explore the historical sequestration of CO2 and its implications for climate change. Discover the impact of CO2 on evolution and the importance of oxygen.

E N D
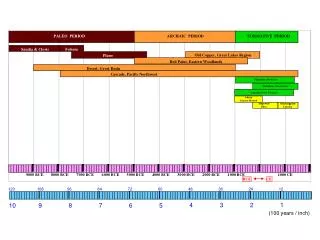
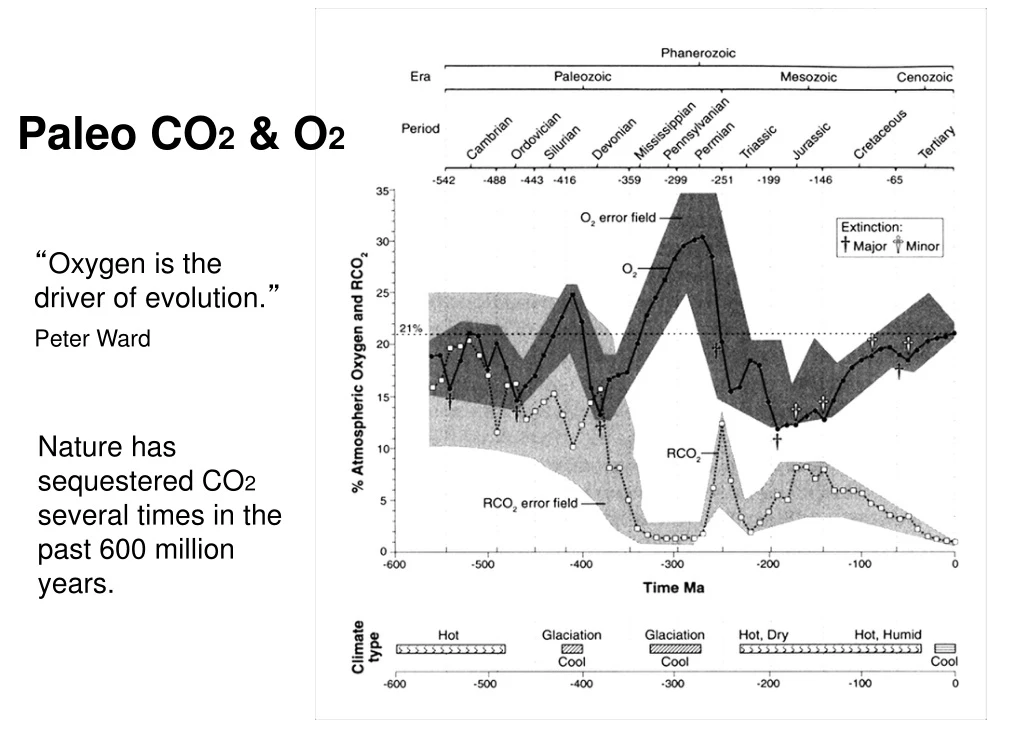
Paleo CO2 (Ward). Paleo CO2 & O2 “Oxygen is the driver of evolution.” Peter Ward Nature has sequestered CO2 several times in the past 600 million years.
Deep Ocean J. Hansen & M. Sato, “Paleoclimate Implications for Human-Made Climate Change” Figure 1 in Climate Change, 2012 Inferences from Paleoclimate and Regional Aspects, eds. Berger, Mesinger & Sijacki Springer-Verlag, Vienna 2012 Deep Ocean Temps over Last 65 Million Years .
Relative Temperatures (°C)by “Continent”over 2,000 Years Phipps, Nature Geoscience, April 2013
CO2 Sink % . James Hansen, 2013: Fig. 3 in “Doubling Down on Our Faustian Bargain”
from the last 20 million years, by van der Wal, cited in “Making Sense of Palaeoclimate Sensitivity,” Hansen et al., Nov. 12. Also, Snyder, Sept. 2016. fast + slow feedback = +9°C at 560 ppm Heating by 3000 CE should fall on the dark blue curve. fast + slow feedback = +5°C at 400 ppm 1.2°C warming is observed at 400 ppm. fast feedback = +3°C at doubling (560 ppm) But it does not include 0.5°C warming hidden by sulfates. ∆°C +1.5°C at 400 ppm Nor does it include albedo effects of future shrinking snow & sea ice extent, time to heat the upper ocean, or positive feedbacks on permafrost & clouds. ppm CO2 Fast feedbacks include cloud cover, snow extent, sea ice, upper ocean heating, carbon emissions from permafrost & methane hydrates, and most aspects of dust & aerosol changes. Slow feedbacks include albedo changes from changes in vegetation and ice sheet extent, plus weathering, plate tectonics, and some aspects of the carbon cycle.
Radiation Forcings IPCC AR5 . Figure TS.7: IPCC, AR5 (2013)
Sulfate Aerosol % . James Hansen, Fig. 6a in Global Temperature Update Through 2012
Temperature ChangesEarth’s LandSurface 1951-80 Baseline 5-Year Moving Average by Latitude - NASA GISS * = only S Patagonia & S Chile, S 25% of NZ
Arctic Sea Ice Volume . Mean by Month PIOMAS
R2 = 87% R2 = 88% R2 = 89% R2 = 82% R2 = 85% R2 = 84% R2 = 79% U of Washington, PIOMAS model, by Wipneus
Snow Observations, 1965-2012 2013 State of the Climate, American Meteorological Organization
Annual Average Cloud Observations, 1982-2012 2013 State of the Climate, American Meteorological Organization 2014 State of the Climate revised the time trend to 0.
Clouds by Altitude Global Monthly Cloud Cover Low less cooling clouds Middle Cloud Cover (%) High less warming clouds more warming clouds International Satellite Cloud Climatology Project 1984 1988 1992 1996 2000 2004 2008 dashed lines by Gene Fry net warming effect. Magnitude?
Sea Levels over Last 24,000 Years 3 meters per century during Meltwater Pulse 1A (1 millennium) 1.5 meters per century from 15 to 8 millennia ago 10 millennia ago, Earth’s surface warmed at a rate of 0.03°C / century. Current warming is 50-150 times as fast, but only 1/3 as much ice is left.
Greenland & Antarctic Ice . Andrew Shepherd et al., “A Reconciled Estimate of Ice-Sheet Mass Balance”, Science 38(6111):1183-1189. Nov. 30, 2012
MacDougall 2012 Permafrost contains ≥ 2 x the carbon in the atmosphere.
Alaska Permafrost . Projections for average annual ground temperature at 1 meter deep. Blue is permafrost. Red surface is above freezing. Draft National Climate Assessment, Figure 22.5, 2013
US Dought Projection . mid-range emissions “Extreme” means Fraction of US Affected observed mean of 19 models individual model results Draft National Climate Assessment, Figure 2.21 - 2013
Future Rain in North America . High Emissions Scenario The map does NOT include differences in evaporation. Global Climate Change in the United States, June 2009, NOAA et al. at 31
Projected Palmer Drought Index Soil Moisture change from local baseline (1902-2010?)
Winters are getting drier… Via NOAA: “Reds and oranges highlight lands around the Mediterranean that experienced significantly drier winters during 1971-2010 than the comparison period of 1902-2010.”
Permafrost Carbon By 2100, permafrost may be adding more carbon to the air than humans, and cumulatively, will have added more than humans have added to date. By 2300, permafrost by itself may well double today’s CO2 levels in the air. Human emissions are no longer the only game in town. We’re heading for a repeat of 55 million years ago (+6°C), but today’s sun heats Earth 1.7°C more, and we’ve burned fossil fuels. Thus it may get even hotter. By 8-9°C? So, we must stop adding carbon to the air, soon, . start subtracting carbon from the air even faster than we are now adding it. AND
Corn, Wheat, Rice, Soy - US, China, India . Major Crops: US, China & India Produce Half of World Total
• World Food Prices . Over 2005-7, . world prices . rose 125% . for wheat, . 100% for corn, . 27% for rice.+. soybeans 83%. in just 1 year.. Look at 2008.. Over 2006-7, . food prices rose . 18% in China, . 13%inIndonesia. & Pakistan, . 10+% in India, . Russia & . Latin America. . Over 2007-8, world food prices rose20-150%.. In the US, food prices rose too: whole wheat bread 12%, milk 29%, eggs 36%. Why? Grain for ethanol, High oil prices UN: Food & Agriculture Organization Rice Wheat Corn 2012 2009 2013 2008 2011 2010 2007 more meat for China, droughts in Australia, Ukraine, Russia ,devalued $. mean more $ for fertilizer & pesticides, & especially to fuel pumps & tractors.
• • • Crop Response Graphs . Yields rise with more CO2 at 1st, but then nitrogen limits kick in. Corn Wheat Soy Soy Wheat today Rice Rice based on Hatfield 2011 26 studies, ‘72-’06, sum. by Hatfield 2011 DesMoines Bismarck Pine Bluff Kolkata Wichita Mean June Temps, ‘81-’10 Corn study CO2 levels = 330 (‘72) to 380 ppm (‘06). Nitrogen & water not constraining. Paleo-climate records show 6°C warming, long-term, for “2 x CO2”(560 ppm). Wheat Corn Soy Rice DesMoines DesMoines Pine Bluff Bismarck Bismarck Pine Bluff Wichita Wichita Kolkata KolkataIndia Mean June Temps Mean June Temps Nitrogen & water not constraining. Yields rise 17% for KS soy, but fall 15% for IA corn, 13% for AR rice, 4% for ND wheat, & 47% for rice in Kolkata. But water tables are falling now, fast. It will get worse.
Green Jobs . • “Six months ago my biggest worry was that an emissions deal would make American business less competitive compared to China.” • “Now my concern is that every day that we delay trying to find a price for carbon is a day that China uses to dominate the green economy.” Senator Lindsay Graham Republican (South Carolina) January 29, 2010
Solutions areout there,ready for acarbon cap. • In January 2007, 10 companies called for a carbon cap & trade system to cut US CO2 emissions 60-80% by 2050. General Electric BP America Caterpillar Alcoa Duke Energy DuPont PNM Resources Florida P&L Pacific G&E Lehman Brothers • In May 2007, 12 companies joined them: General Motors Shell Johnson & Johnson AIG ConocoPhillips Pepsi John Deere Siemens Dow Chemical Alcan Boston Scientific Marsh Inc. More than 40 other big companies are supportive. Examples: Boeing Wal-Mart Staples National Grid Ford Whirlpool Exelon Texas Utilities (revamped) Chevron Chrysler Google American Electric Power Xerox IBM NRG Energy Bank of America
• Scenario: 80% Renewable by 2050 Low Demand, Technology Improvement 7% > TWh than 2012 70% export 41% export 25% > GW than 2012 US Renewable Electricity in 2050 . Renewable Electricity Futures Study Hand, M.M. et al., 2012 Fig. ES-3, Table 3-1 National Renewable Energy Laboratory • 32% import Central Solar 30% export 33% import 41% import
US Electricity Prices . Lazard 2016
Wind Map American Wind Energy Association
• Effects of a US Carbon Tax The tax modeled rises from $10 / metric ton of CO2 in 2016, by $10 / T annually, to $200 / T in 2035. Collectit only at wellheads, mine mouths & borders (for carbon imports). Taxpayers get 100% of it back each year (= $ / Household or = $ / person). US CO2 emissions fall from 5.1 GT per year in 2015 to 2.6 GT in 2035. GNP is 0.2-0.4% higher over 2017-35. Jobs rise > 1% by 2025 (versus the no carbon tax baseline). Only the West South Central states suffer. Job gains are biggest in Health Care, Finance & Insurance, Retail, and Real Estate. Only Manufacturing (Chemicals & Oil) and Mining suffer. The tax saves 10,000 lives a year (mostly from air pollution) by 2021 and 14,000 / year by 2031. Electricity in 2035 is 6% (250 TWh / year) below the base case. Coal (1,500 TWh / year now) is phased out, mostly by 2025. Wind use grows 750, nuclear 700, solar 200, and geothermal 100, but gas falls 500. from REMI’s 2014 analysis, for the Citizens Climate Lobby Changes due to Carbon Tax tl Gross National Product Gross Regional Products 2015 2020 2025 2030 2035 Total Employment MA = Mass. Citizens Climate Lobby advocates a US carbon tax. On its Board are George Shultz, Jim Hansen, Katherine Hayhoe, Bob Inglis et al. 300+ CCL chapters cover 430+ Congressional districts in 50 states. You are invited to join. Go to http://citizensclimatelobby.org.