Stereo Vision
Stereo Vision. John Morris. Vision Research in CITR. Basics. A single image has no depth information Humans infer depth from ‘clues’ in the scene but These are ambiguous Stereo vision systems take two images of a scene from different viewpoints


Stereo Vision
E N D
Presentation Transcript
Stereo Vision John Morris Vision Research in CITR
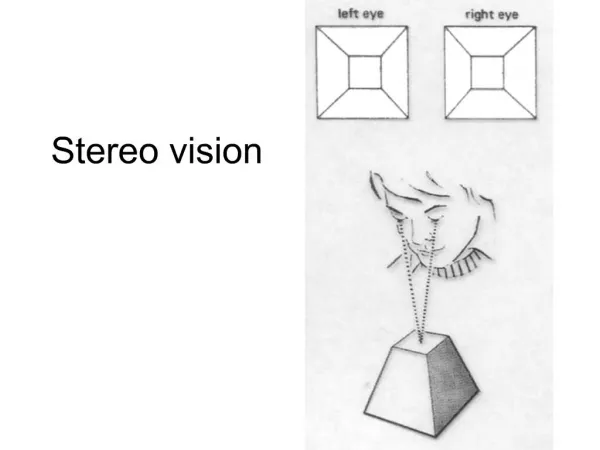
Basics • A single image has no depth information • Humans infer depth from ‘clues’ in the scene but • These are ambiguous • Stereo vision systems take two images of a scenefrom different viewpoints • Usually referred to as left and right images • Left and right images are slightly different • Disparity isDisplacement of corresponding points from one image to the other • From the disparity, we can calculate depth
Stereo Vision - Basics Two cameras: Left and RightOptical centres: OL and OR Virtual image plane is projection of actual image plane through optical centre Baseline, b, is the separation between the optical centres Scene Point, P, imaged at pL and pR pL = 9 pR = 3 Disparity, d = pR – PL = 6 Disparity is the amount by which the two images of P are displaced relative to each other bf Depth, z = pd p = pixel width
Motivation - Applications • Stereo Vision has many applications • Aerial Mapping • Forensics - Crime Scenes, Traffic Accidents • Mining - Mine face measurement • Civil Engineering - Structure monitoring • Collision Avoidance • Real-time performance needed • Depth accuracy critical • Manufacturing • Process control • Process monitoring • General Photogrammetry • Any non contact measurement
Motivation - Advantages Example • Collision avoidance • Why stereo? • RADAR keeps airplanes from colliding • SONAR • Keeps soccer-playing robots from fouling each other • Guides your automatic vacuum cleaner • Active methods are fine for `sparse’ environments • Airplane density isn’t too large • Only 5 robots / team • Only one vacuum cleaner
Motivation - Advantages • Collision avoidance • What about Seoul (Bangkok, London, New York, …) traffic? • How many vehicles can rely upon active methods? • Reflected pulse is many dB below probe pulse! • What fraction of other vehicles can use the same active method before even the most sophisticated detectors get confused?(and car insurance becomes unaffordable ) • Sonar, in particular, is subject to considerable environmental noise also • Passive methods (sensor only) are the only ‘safe’ solution • In fact, with stereo, one technique for resolving problems may be assisted by environmental noise!
Stereo Vision • Goal • Recovery of 3D scene structure • using two or more images, • each acquired from a different viewpoint in space • Using multiple cameras or one moving camera • Term binocular vision is used when two cameras are employed • Stereophotogrammetry Using stereo vision systems to measure properties (dimensions here) of a scene
Stereo Vision • Camera configuration • Parallel opticalaxes
Stereo Vision • Camera configuration • Verging opticalaxes Note that if the cameras are aligned so that the scanlines of both cameras lie in the epipolar planes, then matching pixels must lie in the same scanline on both images. This is the epipolar constraint.
Triangulation Basic Principle • Any visible point in the scene must lie on the straight line that passes through the optical centre (centre of projection) and the projection (image) of the point on the image plane • Binocular stereo vision calculates the position of a scene point by finding the intersection of the two lines passing through the optical centres and the projection of the point in each image
Stereo Vision • Two problems • Correspondence problem. • Reconstruction problem. • Correspondence problem • Finding pairs of matched points in each image that are projections of the same scene point • Triangulation depends on solution of the correspondence problem
Stereo Vision • Correspondence problem • Ambiguous correspondence between points in the two images may lead to several different consistent interpretations of the scene • Problem is fundamentally ill-posed Possible scene points Actual scene points
Reconstruction • Having found the corresponding points, we can compute the disparity map • Disparity maps are commonly expressed in pixels ie number of pixels between corresponding points in two images • Disparity map can be converted to a 3D map of the scene if the geometry of the imaging system is known • Critical parameters: Baseline, camera focal length, pixel size
Reconstruction • Determining depth • In a coordinate space based on the optical centre of the left camera: • A scene point, P = ( Xl , Yl , Zl ) is projected on to the image plane at ( xl , yl ) where • Similarly, in a coordinate space based on the optical centre of the right camera: • A scene point, P = ( Xr , Yr , Zr ) is projected on to the image plane at ( xr , yr ) where
Reconstruction • Determining depth • To recover the position of P from its projections, pland pr : • Cameras are related by a rotation, R, and a translation, T: • Canonical configuration: • Parallel camera optical axes Zr= Zl= Z andXr= Xl– T so we have: where d = xl– xr is the disparity- the difference in position between the corresponding points in the two images, commonly measured in pixels
Reconstruction • Recovering depth • where T is the baseline • If disparity, d’, is measured in pixels,then • d = xl – xr = d’p • where p is the width of a pixel in the image plane,then we have • Z = Tf / d’p Note the reciprocal relationship between disparity and depth! This is particularly relevant when considering the accuracy of stereo photogrammetry
Stereo Camera Configuration • Standard CaseTwo cameras with parallel optical axes b baseline (camera separation) q camera angular FoV Dsens sensor width n number of pixels p pixel width f focal length a object extent D distance to object
Clearly depth resolution increases as the object gets closer to the camera • Distance, z = b f focal length p d pixel size disparity Stereo Camera Configuration Points along these lineshave the same LR displacement (disparity) • Canonical configuration • Two cameras with parallel optical axes • Rays are drawn through each pixel in the image • Ray intersections represent points imaged onto the centre of each pixel • but • An object must fit into the Common Field of View
Stereo Vision • Configuration parameters • Intrinsic parameters • Characterize the transformation from image plane coordinates to pixel coordinates in each camera • Parameters intrinsic to each camera • Extrinsic parameters (R, T) • Describe the relative position and orientation of the two cameras • Can be determined from the extrinsic parameters of each camera:
Correspondence Problem • Why is the correspondence problem difficult? • Some points in each image will have no corresponding points in the other image • They are not binocularly visible or • They are only monocularly visible • Cameras have different fields of view • Occlusions may be present • A stereo system must be able to determine parts that should not be matched These two are equivalent!
Correspondence Problem • Methods for establishing correspondences • Two issues • How to select candidate matches? • How to determine the goodness of a match? • Two main classes of correspondence (matching) algorithm: • Correlation-based • Attempt to establish a correspondence by matching image intensities – usually over a window of pixels in each image • Dense disparity maps • Distance is found for all BV image points • Except occluded (MV) points • Feature-based • Attempt to establish a correspondence by matching a sparse sets of image features – usually edges • Disparity map is sparse • Number of points is related to the number of image features identified
Correlation-Based Methods • Match image sub-windows in the two images using image correlation • oldest technique for finding correspondence between image pixels • Scene points must have the same intensity in each image • Assumes • All objects are perfect Lambertian scatterers • ie the reflected intensity is not dependent on angle orobjects scatter light uniformly in all directions • Informally: matte surfaces only • Fronto-planar surfaces • (Visible) surfaces of all objects are perpendicularto camera optical axes
Correlation-Based Methods • Usually, we normalize c(d) by dividing it by the standard deviation of both Iland Ir(normalized cross-correlation, c(d) [0,1]) where and are the average pixel values in the left and right windows. • An alternative similarity measure is the sum of squared differences(SSD): • Experiment shows that the simpler sum of absolute differences(SAD) is just as good c(d) = | Il(i+k,j+l) – Ir(i+k-d,j+l) |
Correlation-Based Methods • Problem: • Two cameras with slightly different viewpoints • Electronic gain (‘contrast’) and dark noise (‘offset’) differ slightly • Different maximum and minimum intensities • Simple intensity matching fails • Slightly different scattered intensities • Scene objects are not perfect Lambertian scatterers
Correlation-Based Methods • Improvements • Do not use image intensity values, use intensity gradients instead! • One scheme calculates thresholded signed gradient magnitudes at each pixel • Compute the gradient magnitude at each pixel in the two images without smoothing • Map the gradient magnitude values into three values: -1, 0, 1 (by thresholding the gradient magnitude) • More sensitive correlations are produced this way • several dozen moresee Scharstein & Szeliski, 2001 and the Middlebury web pages for a review Many matching functions can be used with varying success!!
Correlation-Based Methods • Comments • The success of correlation-based methods depends on whether the image window in one image exhibits a distinctive structure that occurs infrequently in the search region of the other image. • How to choose the size of the window, W? • too small a window • may not capture enough image structure and • may be too noise sensitive • many false matches • too large a window • makes matching less sensitive to noise (desired) but also • decreases precision(blurs disparity map) • An adaptive searching window has been proposed
Correlation-Based Methods Input – Ground truth 3x3 window Too noisy! 7x7 window Sharp edges are blurred! Adaptive window Sharp edges and less noise
Correlation-Based Methods • Comments • How to choose the size and location of R(pl)? • if the distance of the fixating point from the cameras is much larger than the baseline, the location of R(pl) can be chosen to be the same as the location of pl • the size of R(pl) can be estimated from the maximum range of distances we expect to find in the scene • we will see that the search region can always be reduced to a line
Feature-Based Methods • Main idea • Look for a feature in an image that matches a feature in the other. • Typical features used are: • edge points • line segments • corners (junctions)
Feature-Based Methods • A set of featuresis used for matching • a line feature descriptor, for example, could contain: • length, l • orientation, • coordinates of the midpoint, m • average intensity along the line, i • Similarity measures are based on matching feature descriptors: where w0, ..., w3 are weights (determining the weights that yield the best matches is a nontrivial task).
Correlationvs.feature-based approaches • Correlation methods • Easier to implement • Provide a dense disparity map (useful for reconstructing surfaces) • Need textured images to work well (many false matches otherwise) • Do not work well when viewpoints are very different, due to • change in illumination direction • Objects are not perfect (Lambertian) scatterers • foreshortening • perspective problem – surfaces are not fronto-planar • Feature-based methods • Suitable when good features can be extracted from the scene • Faster than correlation-based methods • Provide sparse disparity maps • OK for applications like visual navigation • Relatively insensitive to illumination changes
Other correspondence algorithms • Dynamic programming (Gimel’Farb) • Finds a ‘path’ through an image which provides the least-cost match • Can allow for occlusions (Birchfield and Tomasi) • Generally provide better results than area-based correlation • Faster than correlation • Graph Cut (Zabih et al) • Seems to provide best results • Very slow • Concurrent Stereo Matching • Examine all possible matches in parallel (Delmas, Gimel’Farb, Morris, work in progress) • Uses a model of image noise instead of arbitrary weights in cost functions • Suitable for real-time parallel hardware implementation
Other correspondence algorithms … and many more!! • See the Middlebury Stereo page for examples and performance comparisons: vision.middlebury.edu/stereo/