Download
1 / 28
280 likes | 370 Views
Explore the application of log-linear models in analyzing DNA sequences to improve annotation quality and gain insights into evolutionary processes affecting DNA diversification. Understand different Markov chain models, estimation techniques, and hypothesis testing for DNA sequences. Discover the power and limitations of different model orders in fitting DNA data. Learn how to employ alternative log-linear models for short DNA functional regions and improve the analysis of non-coding DNA segments.

E N D
Special type of log linear models to fit DNA. Irina Abnizova1, Brian Tom1 and Walter R. Gilks2 1 MRC Biostatistics Unit, Cambridge 2 Leeds University, Leeds
Why to fit models to DNA • improve annotation quality • understanding of evolutionary processes leading to DNA diversion • about DNA: • DNA has the form of four states (A,C,G,T nucleotides or • base pairs) positioned in space • can be “read” in specific direction for coding parts • low order Markov models are used, e.g. for predicting the • occurrence of certain sequences as CTGAC etc
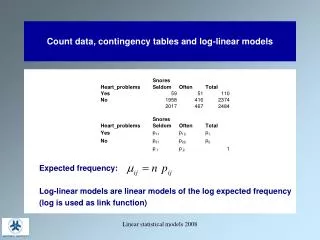
As known from (Avery and Henderson 1999), • DNA can often be modelled by Markov chain • Analysis in the context of log linear models • Peculiar features: • The data produce contingency tables with the similar margins (dependence of the observations). • However, the analysis is the same as for multinomial samples. • Standard number of degrees of freedom is correct
recall: Markov chain model Def: A sequence of random variables is called a Markov chain of the orderk, if each state in the chain depends only on its k previous neighbours For DNA • 1st order Markov chain models two-residue dependence. • A 0th order Markov chain models the distribution of independent residues.
How to estimate the Markov modelfor a given stretch of DNA approximate the parameters by multi-nucleotide frequencies: for 1st order Markov model: • Initial distribution: via the occurrences of each particular residue, e.g. pa=Na/L • Transitional probability matrix via the number of occurrences of the each adjacent pair, Nij.
Dependencies within DNA Definition: Independent state model, M0 - the state in a particular position is independent of the previous state Notation: Nij =occurrence of (i,j) pair Two-way table is formed by counting 16 pairs: S A C G T A Naa Nac Nag Nat F C Nca Ncc Ncg Nct G Nga Ngc Ngg Ngt T Nga Ngc Ngg Ngt
Example: kni-cis regulatory region, Drosophila melanogaster S A C G T total A 140 62 58 75 335 C 54 53 67 69 243 F G 69 71 80 61 281 T 72 56 77 189 394 total 335 242 282 394 1253 (Bishop et al. 1975) calculate expectations by using the marginal totals, assuming independence: Eij=Xi.X.j/X.., Xi.=number of times i occurs in the position First, X.j=number of times j occurs in the position Second, X..=number of all pairs
Then we compute: • the Pearson chi-square statistics X2 and/or • minus twice the likelihood ratio statistics G2 : • Both follow asymptotic chi-square with df=9 • Compare against a chi-square distribution • If the null hypothesis of independence is correct, • we have a distribution with 9 degrees of freedom • Both statistics here are more than 100.2… Hypothesis of independence should be rejected Typical for DNA!
Alternative formulation (Avery, Henderson1999) is as a generalised linear model with a log-link, Poisson error structure and linear predictor: is the overall mean, Fi refers to the first position, Sj-to the second of the pair (i,j) We fit the model for kni_cis data with R:
Null deviance: 194.79 on 15 degrees of freedom Residual deviance: 112.03 on 9 degrees of freedom D=G2 here, similarly used: again, the null is rejected! Fitting first order Markov model, M1 • We might • Assess if first order Markov model, M1 describes the data • Analyse a three-way table for triplets (i,j,k)
Table 2 : The triplet counts for kni-cis regulatory region, D. A C G T A 65 19 12 16 C 23 9 19 11 A G 27 15 18 6 T 25 11 20 39 A 24 14 19 11 C 8 11 15 12 C G 14 17 19 10 T 16 11 18 23 A 24 18 13 19 C 8 13 26 16 G G 14 19 17 16 T 12 17 24 26 A 27 11 13 29 C 15 20 7 30 T G 14 20 26 29 T 19 17 15 101
Fitting first order Markov model • extension of independence model: a model with linear predictor: No dependence between First and Third positions; Df=4(4-1)2=36, we need 64 observations, And 48 parameters to estimate
The expected values are given by Eijk=Xji.X.jk/X.j. using notation similar to the two-way case. Fitting higher order Markov model m2: df=144 (256 observations and 112 parameters) m3: (1024 observations and 448 parameters) Avery, Henderson 1999 claim that M1 fits the most non-coding DNA they tried. We did not find it for regulatory regions
Power of the test for Markov model • order of the Markov model increases ability of the test to discriminate between different models decreases • order of the Markov model increases sample size (length L) is more important: lack of the data • e.g. for fitting M2 (four-way table with 256 elements) with the power 80% we need at least 1250 bp long sequence! • for M2, most cells have expected values less than 6 for a sequence of around 1500 bp, thus we will not have asymptotic chi-square with df=144 • merging sequences is not good: we loose biological sense That is why we suggest the following model:
Special type of log linear models to fit DNA. alternative type of log linear models, for short DNA functional regions • Our personal motivation: to use the models for • Distinguishing DNA functional types, specially interested • in regulatory DNA • 2. Search for regulatory motifs
About gene regulation Protein • Genes: code for proteins • (exons) • Geneheader regulates • transcription rate translation RNA transcript Header Gene transcription
Regulation of transcription header RNA transcript RNA tr Translation, Gene other header Other gene Transcription factors: Far-away headers
Biological Observations about Regulatory elements (TFBS) • Short (5-15 bp) sub-sequences • Often arranged and closely packed in Cis-Regulatory Modules • (CRM) within regulatory regions • Likely to be Over- and Under-Represented Suggests certain statistical properties which might be captured with appropriate models
Data setsDrosophila melanogaster 1 Regulatory Regions, 60 experimentally Verified Sequences, 600-2500 bp each 2. Internal exons, Randomly picked, 60 sequences of similar to 1 lengths 3. Non coding Presumably non regulatory DNA, Randomly picked, 60 sequences
Fitting Markov models Limitations: 1. length of sequence analysed e.g. required 1250 bp to fit second order MC, while average human exon length is 146 bp… 2. requirement of stationary distribution DNA is very non-stationary
Faster method, requires less information Assume (for each individual sequence): • most nucleotides occur independently • overall independence is disrupted by certain words: • cores of TFBS (regulatory regions) • stop-codons (exons) • simple repeats (‘junk’ DNA) Length of ‘disruptive’ words is responsible for the “memory” of the model, k
Instead of fitting higher order model, we first study standardised residuals • The significant standardized residuals (>2) for independence model were: Pearson pair 5.8495 tt 5.3292 aa -3.2483 ta -2.9560 at -2.9106 gt -2.3037 tc 2.2708 gc 2.1073 gg -2.0033 ag
Assume all pairs are independent except of aa and tt (see Pearson residuals) Where Gh(i,j) ={1 if i=j=a or t; 0 else} Now we have Residual deviance: 8.9785 on 8 degrees of freedom The model ‘independence except’ describes the data well! Biological explanation: there are a lot of TFBS “TT” and ‘AA’ rich words (TFBS: bicoid, huncnback,kruppel etc)
Fitting three-way independent-except model • The length of the most repetitive or rare patterns may be more than two base pairs. • Compute three-way table, assuming that all nucleotides are independent except of some triples. • Requires much less DNA information than conventional • M1, M2 models. • k=2 for this ‘3-wayM0 except’ model • k+1 is the length of most disruptive patterns
Fitting multi-way independent-except model • We successively compute four-, five- etc way tables if three-way Independent models do not fit our data. • k=3,4.. for these models • k+1 is the length of most disruptive patterns
Results: given k and ‘disruptive’ patterns, we may separate between functional DNA • Coding regions: best fit is k = 0 or 1 • Disruptive is (-ta) • Regulatory Regions: best fit is k=2 or 3 • Disruptive are 3-4 short motifs ( aaa, ttt,cgg ) • Non coding non regulatory regions: k > 0,1 • Disruptive are( If k > 1) only one or two short motifs • (almost any 16 pair motifs) P.S. -ta is everywhere…
Presently we fit each sequence separately to determine the “best” fitting model for that sequence • However sequences of the same DNA functional type are expected to be more similar to each other than sequences of different types • Therefore can we identify what is common amongst sequences of the same type? • Also can we discriminate between the different types?
Acknowledgements David Ohlssen Rene te Boekhorst