Download

1 / 23
230 likes | 400 Views
Gross Domestic Product and Growth. Gross Domestic Product. Gross Domestic Product is the usual measure of how well an economy is doing. GDP is the combined total of all production within a country’s borders.

E N D
Gross Domestic Product • Gross Domestic Product is the usual measure of how well an economy is doing. GDP is the combined total of all production within a country’s borders. • There are two main ways of measuring GDP: 1 Total of all finished goods and services, or 2 total of all incomes. Theoretically, these numbers should come out the same.
Measuring GDP • GDP (Y), is the total of: • Consumption (C) • Investment (I) • Government Purchases (G) • And net exports (NX) • Y = C + I + G + NX
Government Purchases 15% Net Exports -5 % Investment 16% Consumption 70% GDP and Its Components (2004)
Real GDP Real GDP Based on 2000 $$ (a) Real GDP Billions of 2000 Dollars $10,000 9,000 8,000 7,000 6,000 5,000 4,000 3,000 2,000 1965 1970 1975 1980 1985 1990 1995 2000 2005
These numbers do not mean much by themselves, so GDP is compared to the GDP of previous years, so that the percentage of increase or decline can be seen. • Because the prices of various goods can change, two different numbers need to be used, Nominal GDP and Real GDP. • Nominal GDP is the raw number, and the Real GDP is adjusted for inflation, usually based on a particular year. Mew = Mortgage Equity Withdrawal
THE CONSUMER PRICE INDEX • The consumer price index (CPI)is a measure of the overall cost of the goods and services bought by a typical consumer. • The Bureau of Labor Statisticsreports the CPI each month. • It is used to monitor changes in the cost of living over time. • The Bureau of Labor Statistics (BLS) identifies a market basket of goods and services the typical consumer buys. • The BLS conducts monthly consumer surveys to set the weights for the prices of those goods and services.
How the Consumer Price Index Is Calculated • Choose a base year and compute the index. • Designate one year as the base year, making it the benchmark against which other years are compared. • Compute the index by dividing the price of the basket in one year by the price in the base year and multiplying by 100.
17% Transportation 15% 42% Food and beverages Housing Education and 6% communication 6% 6% 4% 4% Medical care Other goods Recreation Apparel and services FYI: What Is in the CPI’s Basket?
How the Consumer Price Index is used to calculate Inflation • Compute the inflation rate. The inflation rate is the percentage change in the price index from the preceding period. • The inflation rate is calculated as follows:
The GDP Deflator • The GDP deflator is a measure of the price level calculated as the ratio of nominal GDP to real GDP times 100. • It tells us what portion of the rise in nominal GDP that is attributable to a rise in prices rather than a rise in the quantities produced. • The GDP Deflator number is derived by examining the aggregate rise in prices in goods that people purchase during a year. • Nominal GDP is converted to real GDP as follows: Real GDP = Nominal GDP/GDP Deflator x 100
CPI GDP deflator Two Measures of Inflation Percent per Year 15 10 5 0 2005 1965 1970 1975 1980 1985 1990 1995 2000
GDP does not give a completely accurate measure of the overall economic activity though, as there are many parts of an economy that cannot be easily defined. • Many activities, such as mowing the lawn, or cleaning your house, unless done by someone else (and reported to the IRS), are not a part of the GDP. • Then there is an underground economy, where employers hire people to do work, but it is not reported (and therefore no taxes are paid), and can include black market activities. • Negative externalities are not reported, and damage to the environment or to people cannot be quantified. • Finally, benefits that people get from places like parks cannot be added in because there is no way to figure out how much the benefit is.
GDP also does not take into account other factors, like the depreciation of goods over time (meaning they have less value as time goes on). • When including this, we have Net National Product (NNP). • When taxes are figured in, we come up with two additional measures, pre-tax personal income (PI) and disposable personal income (DPI) which is the amount of money people have available for spending after taxes are paid.
GDP is affected by the total supply of goods, and the total demand for goods, or the aggregate supply and aggregate demand for goods. The equilibrium point for AS and AD roughly determines the GDP.
Aggregate Supply and Aggregate Demand • The aggregate-demand curve shows the combined quantity of goods and services that households, firms, and the government want to buy at each price level. • The aggregate-supply curve shows the combined quantity of goods and services that firms choose to produce and sell at each price level.
2. . . . and growth in the Long-run money supply shifts aggregate aggregate demand . . . supply, LRAS LRAS LRAS 1980 1990 2000 1. In the long run, technological progress shifts long-run aggregate P 2000 supply . . . 4. . . . and ongoing inflation. P 1990 Aggregate Demand, AD 2000 P 1980 AD 1990 AD 1980 Y Y Y 1980 1990 2000 3. . . . leading to growth in output . . . Long-Run Growth and Inflation Price Level Quantity of 0 Output
Business Cycles • Businesses, and the economy, go through regular cycles that can be identified.
Contractions • Contractions can have different characteristics depending on how long or severe they are. • If real GDP falls for two consecutive quarters (6 months), this is called a Recession. • An unusually severe recession can be called a Depression, though there is no defined period for this. • Stagflation is a situation where the economy is stalled or contracting, and inflation is going up (usually inflation falls during a contraction).
The phases of a business cycle can be triggered by many different factors, including investment, interest rates, consumer expectations, and external shocks. • To try and predict the business cycle, economists try to use what are called Leading Indicators, which are a fairly well known set of variables that when they change, it usually leads to a known outcome. • For example, the purchasing of capital goods (large machines used to make other goods) is usually a good indicator that the economy will be expanding. • Interest rates are another indicator, since lower interest rates encourages borrowing, which can lead to increases in the economy.
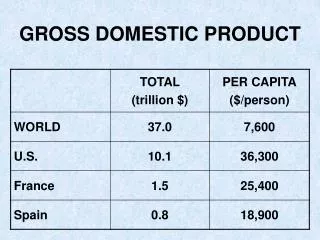
Economic Growth • To get a more accurate view of how well a nation is doing, more specific numbers, such as the GDP per capita (Gross Domestic Product per person), unemployment rates, spending on infrastructure (such as roads and schools), and other items gives a better view. • Other factors are also important, such as life expectancy, capital goods in relation to population, savings per capita, population growth, foreign trade, technology, education levels, research, and resources.
Total GDP 2006 Ranking Economy (millions of US dollars) 1 United States 13,201,819 11 Russian Federation 986,940 2 Japan 4,340,133 12 India 906,268 3 Germany 2,906,681 13 Korea, Rep. 888,024 4 China 2,668,071 14 Mexico 839,182 5 United Kingdom 2,345,015 15 Australia 768,178 6 France 2,230,721 a 16 Netherlands 657,590 7 Italy 1,844,749 17 Turkey 402,710 8 Canada 1,251,463 18 Belgium 392,001 9 Spain 1,223,988 19 Sweden 384,927 10 Brazil 1,067,962 20 Switzerland 379,758