Download
1 / 51
510 likes | 670 Views
Early Intervention Services: The Economic Case. Paul McCrone, 1 A-La Park, 2 Martin Knapp 1,2 1 Institute of Psychiatry, King’s College London, 2 PSSRU, London School of Economics. Background. Deinstutionalisation in UK started in 1980s and is largely complete

E N D
Early Intervention Services: The Economic Case Paul McCrone,1 A-La Park,2 Martin Knapp1,2 1 Institute of Psychiatry,King’s College London, 2 PSSRU,London School of Economics
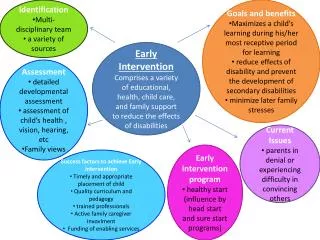
Background • Deinstutionalisation in UK started in 1980s and is largely complete • Community mental health teams (CMHTs) developed often using case-management techniques • In 2001 the government stating that specialist teams should be provided throughout England • Assertive community treatment (ACT) • Crisis resolution (CRT) • Early intervention (EI) • Are these services a good investment?
Early Intervention in Psychosis Services • Intervening early is encouraged in other clinical areas (e.g. cancer, heart disease) • Onset of psychosis frequently not recognised • Duration of untreated psychosis (DUP) can be up to 2 years • Longer DUP is associated with poorer outcome • EI services provide rapid care using a multidisciplinary team approach • Varied interventions • Medication • Psychological therapies • Vocational support • EI is generally time limited (around 3 years in England)
Why Consider Cost-Effectiveness? • Increasing number of studies evaluating EI services • New services clearly require scarce resources and therefore economic evaluation is essential • Are the extra costs of EI offset by reduced costs elsewhere in the system? • Is EI cost-effective?
Interpretation of Results from Economic Evaluations Outcomes Costs
What Type of Evidence? Randomised controlled trials Long-term follow-up observational studies Decision models
Decision Models • A way of assessing costs and cost-effectiveness • Alternative or supplementary to trial • Advantages: • Results can be produced quickly • Models can be adapted to aid generalisability • Allows a focus on certain key parameters of interest • Disadvantages • Models are by definition an abstraction from reality • Data are required for probabilities and costs and these are not always available
Data Required for Model • Probabilities • clinical trials (LEO) • audit data (Worcestershire and Northumberland EI services) • routine data (28-day readmission rates) • expert judgement • Costs • existing economic studies of EI • economic studies in other areas • non-economic studies
Base Case Data: Probabilities D = default probability
Sensitivity Analyses (1) • Key parameters increased/decreased by 50% • probability of initial formal admission • probability of initial informal admission • probability of readmission • probability of remaining with EI team/CMHT
Sensitivity Analyses: Results (1) Std care EI
Sensitivity Analyses (2) • Probabilistic sensitivity analysis • all parameters varied simultaneously • Monte Carlo analysis • data drawn from parameter distributions • 100,000 resamples • cost distributions generated
Vocational Model: Parameters Sources: Garety et al, 2006; Perkins & Rinaldi, 2002; Major et al, 2010
Homicide Model: Parameters Sources: Nielssen & Large, 2008; Home Office, 2004
Suicide Model: Parameters Sources: Melle et al, 2006; Robinson et al, 2010, McDaid & Park, 2010; Platt et al, 2006
Scenarios for Long-Term Model • Scenario 1. Readmission rates are constant throughout all the 48 cycles for both EI (12%) and standard care (20%). • Scenario 2. Readmission rates for EI for the first three years are constant, and then suddenly become the same as for standard care. • Scenario 3. Readmission rates for EI after three years gradually become similar to those for standard care.
Eight Year Costs of EI and SC £17,427 £27,029 £36,632
Cost-Effectiveness of EI:The LEO Study Craig et al (2004) BMJ 329: 1067 Garety et al (2006) Br J Psychiatry 188: 37-45 McCrone et al (2010) Br J Psychiatry 96: 377-382
Methods (1) • Lambeth Early Onset (LEO) service • Deprived area of inner-London • For first episode psychosis or those for with second episode where care was never received • Patients identified by screening for possible psychosis • Randomised controlled trial conducted including 144 patients (71 to EI, 73 to standard care) • Assessments at baseline, 6 months and 18 months • Primary outcome measure was relapse and hospitalisation
Methods (2) • EI • Provided ACT • Focus on maximising engagement, psychosocial recovery and relapse prevention • 10 staff members (psychiatrists, psychologists, occupational therapists, nurses, healthcare assistants) • Interventions included low-dose medication, CBT, family therapy and vocational rehabilitation • SC (standard care) • CMHTs with no extra training in dealing with first episode psychosis
Methods (3) • 6-month service use measured at each assessment with CSRI • Data on hospital admissions available for entire follow-up period • Service use data combined with unit costs • Cost-effectiveness analysis used vocational recovery and quality of life data
Sample 71 randomised to EI and 73 to SC Mean age: EI 26 years, SC 27 years Men: EI 55%, SC 74% First episode: EI 86%, SC 71% BME: EI 62%, SC 75% Employment: EI 19%, SC 18% Schizophrenia: EI 72%, SC 67%
Inpatient Use and Costs (2003/4 £s) at Baseline and 18-Month Follow-Up 95% CI of cost difference -£8128 to £3326)
Outcomes Vocational recovery at 18m FU: EI 33%, SC 21% (p = 0.162) Quality of life (MANSA): EI 59.3, SC 53.3 (p = 0.025) EI was dominant – lower costs and better outcomes
Conclusions from LEO Study • EI resulted in reduced inpatient use • Costs were lower for EI (although not significantly) • When combined with outcomes, EI is very likely to be cost-effective
Summary • Initial model has demonstrated savings in care costs for EI compared to SC • Large savings due to increased employment • Small savings due to reduced homicide and suicide • Long-term cost savings depend on convergence in readmission rates • LEO study revealed lower costs, better outcomes and (therefore) cost-effectiveness
How do findings compare with those from other studies? • Australia - savings of $AUD 7110 (Mihalopoulos et al, 1999) • Long-term savings of $AUD 6058 (Mihalopoulos et al, 2009) • Canada – EI $2371, SC $2125 (Goldberg et al, 2006) • England – 54% fewer bed days (Dodgson et al, 2008) • Norway & Denmark – weeks in hospital EI 16.4, SC 15.5 (Larsen et al, 2006) • Denmark – inpatient days in year 1 EI 62, SC 79; year 2 EI 27, SC 35; years 3-5 EI 58, SC 71 (Petersen et al, 2005; Bertelsen et al, 2008) • Norway – admissions EI 33%, SC 50% (Grawe et al, 2006) • Sweden – cost savings of 29% year 1, 55% year 2, 61% year 3 (Cullberg et al, 2006)