Download
1 / 32
330 likes | 629 Views
Chapter 2 The Market for Foreign Exchange. Lecture 2a. The Foreign Exchange Market. Exchange Rate The value of one currency relative to another currency as the number of units of one currency required to purchase one unit of the other currency.

E N D
Chapter 2The Market for Foreign Exchange Lecture 2a
The Foreign Exchange Market • Exchange Rate • The value of one currency relative to another currency as the number of units of one currency required to purchase one unit of the other currency. • Foreign-Currency-Denominated Financial Instrument • A financial asset, such as a bond, a stock, or a bank deposit, whose value is denominated in the currency of another nation.
Currency Trading Tables • Typical FX tables in a daily business publication provide spot and forward rates. • US $ equivalent or US $ per currencyis the dollar price of a unit of foreign currency (eg., $/€). • Currency per US $ is the foreign currency price of one US dollar (eg., €/$).
Some Additional Terminology:Direct - Indirect Quotes • Direct quote is the home currency price of a foreign currency. • Indirect quote is the foreign currency price of the home currency.
Appreciating and Depreciating Currencies • A currency that has lost value relative to another currency is said to have depreciated. • A currency that has gained value relative to another currency is said to have appreciated. • These terms relate to the market process and are different from devaluation and revaluation (Chapter 3).
Appreciating and Depreciating Currencies • We use the percentage change formula to calculate the amount of appreciation or depreciation. • Example, suppose on Monday the Mexican peso traded at 11.3855 MXN/USD, whereas on Tuesday it traded at 11.1245 MXN/USD. • The peso has appreciated, as it now takes fewer pesos to purchase each dollar. • The amount of appreciation is: [(11.1245 – 11.3855)/11.3855] •100 = -2.29%
Cross-Rates: Unobserved Rates • A cross-rate is an unobserved rate that is calculated from two observed rates. • For example, the spot rate for the Canadian dollar is 1.3176 C$/$, and the spot rate on the euro is 1.2153 $/€. What is the Canadian dollar price of the euro (C$/€)? • Note that (C$/$)·($/€) = C$/€. • In this example, (1.3176)· (1.2153) = 1.6013 C$/€.
Bid - Ask Spreads • The bid is the price the bank is willing to pay for the currency, e.g., 1.2148 $/€ is the bid on the euro in terms of the dollar. • The ask is what the bank is willing to sell the currency for, e.g. 1.2158 $/€, is the ask on the euro in terms of the dollar. • The typical rate quoted in a daily publication is the midpoint of these two values, e.g., 1.2153.
Bid - Ask Spread and Margin • The bid - ask spread of a currency reflects, in general, the cost of transacting in that currency. • It is calculated as the difference between the ask and the bid. • For example, 1.2158 – 1.2148 = 0.001. • The bid - ask spread can be converted into a percent to compare the cost of transacting among a number of currencies. • The margin is calculated as the spread as a percent of the ask. (Ask - Bid)/Ask * 100 • Example, (1.2158 – 1.2148)/1.2158 * 100 = 0.082%.
Real Exchange RatesReal Measures • Nominal variables, such as an exchange rate, do not consider changes in prices over time. • Real variables, on the other hand, compensate for price changes. • A real exchange rate, therefore, accounts for relative price changes, or in other words, for differences in inflation between the two nations.
Real Exchange Rates • A nominal exchange rate indicates the rate of exchange between one nation’s currency with the currency of another nation. • Real exchange rates indicate the purchasing power of a nation’s residents for foreign goods and services relative to their purchasing power for domestic goods and services. • A real exchange rate is an index. Hence, we compare its value for one period relative to its value in another period, or the change in the index from one period to another.
Real Exchange RatesAn Example • In 1990 the spot rate between the dollar and the peso was 2.9454 (MXN/$). • In 1995 the rate was 7.6425. • Hence, the peso depreciated relative to the dollar by 159.5 percent {[(7.6425-2.9454)/2.9454]*100}. • Based on this alone, the purchasing power of US residents for Mexican goods and services (relative to US goods and services) rose by 159 percent.
Example: Continued • In 1990 the Mexican CPI was 100 and the US CPI was 100. In 1995, the CPI’s were 224.5 and 116.8 respectively. • Based on this, Mexican prices rose 124.5 percent while US prices rose 16.8 percent, a 107.7 difference. • Since the prices of Mexican goods and services rose faster than the prices of US goods and services, there was a decline in purchasing power over Mexican goods and services relative to the purchasing power over US goods and services.
Combining the Two Effects • A real exchange rate combines these two effects - the gain in purchasing power of US residents due to the nominal depreciation of the peso and the decline in relative purchasing power due to Mexican prices rising at a faster rate than US prices. • To construct a real exchange rate, the spot rate, as it is quoted here, is multiplied by the ratio of the US CPI to the Mexican CPI. (MXN/$) • (CPIUS/CPIMX)
Combining the Two Effects • 1990 Real Rate = 2.9454 x (100/100) = 2.9454. • 1995 Real Rate = 7.6425 x (116.8/224.5) = 3.9761. • The real depreciation of the peso was 34.99 percent.
Conclusion • The nominal exchange rate change resulted in a 159.5 percent gain in the purchasing power of Mexican goods and services for US residents. • The difference in price changes resulted in a 107.7 percent loss of purchasing power of Mexican goods and services relative to US goods and services for US residents. • Note how the 159.5 percent gain was partially offset by the 107.7 loss, resulting in an overall 35 percent gain in purchasing power.
Effective Exchange Rates • On any given day, a currency may appreciate in value relative to some currencies while depreciating in value against others. • An effective exchange rate is a measure of the weighted-average value of a currency relative to a select group of currencies. • Thus, it is a guide to the general value of the currency.
Weighted Average Value • To construct an EER, we must first pick a set of currencies we are most interested in. • Next, we must assign relative weights. In the following example, we weight the currency according to the country’s importance as a trading partner.
Weights • Suppose that of all the trade of the US with Canada, Mexico, and the UK, Canada accounts for 50 percent, Mexico for 30 percent, and the UK for 20 percent. • These constitute our weights (0.50, 0.30, and 0.20). • Now consider the following exchange rate data.
Exchange Rate Data Currency 2004 Value 2003 Value Canadian Dollar 1.31 $C/$ 1.39 Mexican Peso 11.4 P/$ 10.9 British Pound 0.56 £/$ 0.64
Calculating the EER • The EER is calculating by summing the weighted values of the current period rate relative to the base year rate. • The weighted-average value is calculated as: Σ[(Weight i)(current exchange value i)/(base exchange value i)] Where i represents each individual country included in the weighted average.
Calculating the EER • Commonly this sum is multiplied by 100 to express the EER on a 100 basis. • As we shall see next, the base-year value of an index measure is 100. • The index, therefore, is useful is showing changes in the weighted average value from one period to another.
Example • Let 2003 be the base year. • The effective exchange rate for 2003 was: [(1.39/1.39)•0.50 + (10.9/10.9)•0.30 + (0.64/.64)•0.20]•100 = 100. • As with any index measure, the base year value is 100.
Example • The value of the EER for 2004 is: [(1.31/1.39)•0.50 + (11.4/10.9)•0.30 + (0.56/0.64)•0.20] • 100 • Or 96.0 • The dollar, therefore, has experienced a 4 percent depreciation in weighted value.
Effective Exchange Measures • There are a number of effective exchange measures available in the popular press. Some common measures are: • Bank of England Index: The Economist and Financial Times. • J.P. Morgan: The Wall Street Journal. • International Monetary Fund, International Financial Statistics.
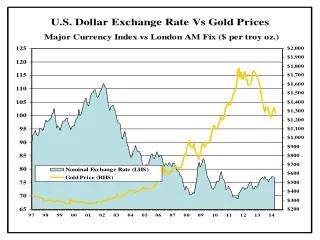
Effective Exchange RatesJapan, United Kingdom, United States Between 1985 and 1995, the average value of the U.S. dollar and the British pound declined, while the average value of the Japanese yen increased. This trend reversed in 1995, but began anew in 2002. SOURCE: Data from the Bank of England.
Arbitrage:Consistency of Cross Rates • Arbitrage is the simultaneous buying and selling to profit (as opposed to speculation). • The ability of market participants to arbitrage guarantees that cross rates will be, in general, consistent. • If a cross rate is not consistent, the actions of currency traders (arbitrage) will bring the respective currencies in line.
Spatial Arbitrage • Spatial Arbitrage refers to buying a currency in one market and selling it in another. • Price differences arise from geographical (spatial) dispersed markets. • Due to the low-cost rapid-information nature of the foreign exchange market, these prices differences are arbitraged away quickly.
Triangular Arbitrage • Triangular arbitrage involves a third currency and/or market. • Arbitrage opportunities exist if an observed rate in another market is not consistent with a cross-rate (ignoring transaction costs). • Again, profit opportunities are likely to be arbitraged away quickly, meaning that cross-rates are, for the most part, consistent with observed rates.
The US dollar is trading for 1.7936 ($/£) and the Polish zloty for 6.5492 (Z/£) in London, while the zloty is trading for 3.7826 (Z/$) in New York. The cross-rate in London is: 6.5492/1.7936 = 3.6514 (Z/$) Hence, an arbitrage opportunity exists. Triangular Arbitrage: Example
Example Continued • A trader with £1, could buy $1.7936 in London. • The $1.7936 would purchase Z6.7845 in New York. • The Z6.7845 purchases £1.0359 in London. This is a profit of £0.0359 or 3.59 percent profit on the transaction. • To understand the arbitrage opportunity, remember “buy low, sell high.”
Triangular Arbitrage Buy $ in London Purchase £ in London Purchase Z in New York