Download
1 / 1
10 likes | 143 Views
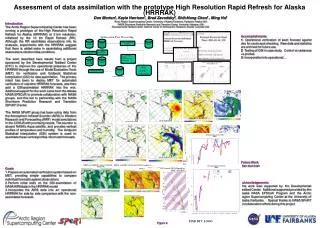
Assessment of data assimilation with the prototype High Resolution Rapid Refresh for Alaska (HRRRAK) . Don Morton 1 , Kayla Harrison 1 , Brad Zavodsky 2 , Shih-Hung Chou 2 , Ming Hu 3 1 Arctic Region Supercomputing Center, University of Alaska Fairbanks, Fairbanks, Alaska USA

E N D
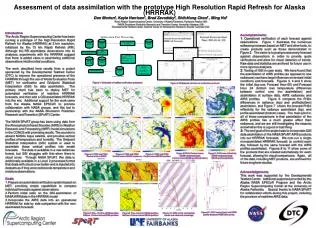
Assessment of data assimilation with the prototype High Resolution Rapid Refresh for Alaska (HRRRAK) Don Morton1, Kayla Harrison1, Brad Zavodsky2, Shih-Hung Chou2 , Ming Hu3 1Arctic Region Supercomputing Center, University of Alaska Fairbanks, Fairbanks, Alaska USA 2NASA Short-term Prediction Research and Transition Center, Huntsville, Alabama USA 3Developmental Testbed Center, National Center for Atmospheric Research, Boulder Colorado USA Introduction The Arctic Region Supercomputing Center has been running a prototype of the High Resolution Rapid Refresh for Alaska (HRRRAK) at 3 km resolution, initialized by the 13 km Rapid Refresh (RR). Although the RR assimilates observations into its analyses, experiments with the HRRRAK suggest that there is added value in assimilating additional observations into the initial conditions. The work described here results from a project sponsored by the Developmental Testbed Center (DTC) to improve the operational presence of the HRRRAK through the use of Model Evaluation Tools (MET) for verification and Gridpoint Statistical Interpolation (GSI) for data assimilation. The primary intent has been to deploy MET for automated verification of real-time HRRRAK forecasts, and then add a GSI-assimilated HRRRAK into the mix. Additional support for the work came from the Alaska NASA EPSCoR to promote collaboration with NASA groups, and this led to partnership with the NASA Short-term Prediction Research and Transition (SPoRT) Center. The NASA SPoRT group has been using data from the Atmospheric Infrared Sounder (AIRS) in Weather Research and Forecasting (WRF) model simulations in the CONUS with promising results. The sounder is aboard NASA’s Aqua satellite, and provides vertical profiles of temperature and humidity. The Gridpoint Statistical Interpolation (GSI) system is used to assimilate these vertical profiles into model forecasts. The data is available in a raw radiances format, but GSI struggles with this when there is cloud cover. Through NASA SPoRT, this data is additionally available in a Level 2 processed format that deals with cloud cover better and is injected into datasets as if they were radiosonde temperature and moisture observations. Accomplishments 1: Operational verification of each forecast against observations. Figure 1 illustrates the numerous software processes based on MET and other tools, to create products such as those demonstrated in Figure 2. The vision is to post-process every forecast against observations in order to provide quick verifications and allow for visual detection of trends. Raw data and statistics are archived for future use in more rigorous analyses. 2: Testing of GSI in case study. We have found that the assimilation of AIRS profiles (as opposed to raw radiances) can have large influences on revised initial conditions and forecasts. Figures 3, 4 and 5 show the initial (top row, Forecast Hour 00) and Forecast Hour 24 (bottom row) temperature differences between control runs (no assimilation) and assimilation of surface data, AIRS radiances and AIRS profiles. Figure 6 compares the FH24 differences in radiance (top) and profile(bottom) assimilation, and Figure 7 shows the forecast FH24 reflectivity for the radiance assimilated (top) and profile assimilated (bottom) cases. The main point in all of these comparisons is that assimilation of the AIRS profiles has a much greater effect than radiances, and we are still investigating the reasons and whether this is a good or bad thing. 3: The end goal of the project was to incorporate GSI data assimilation of the NASA SPoRT AIRS products into our HRRRAK forecasts. We now run a single non-assimilated HRRRAK forecast (a control) each day, followed by the same forecast with the AIRS profiles assimilated. Figures 8 to 11 show some of the products that are created automatically for each forecast, allowing for visual comparisons. Again, all of the data, including MET products, are archived for future long-term studies. Verification Post Processing GDAS prepbufr HRRRAK netcdf wrfout files U Wyoming Raobs Raobs vs HRRRAK Soundings WRF postprocessor (wrfout2grib) FetchPREPBUFRAndDecode (used PB2NC) • R Scripts • Boxplots • Station time series • Scatter plots GDAS netCDF HRRRAK GRIB1 Web graphics with menu pointstat output RunForecastPointStat Archived long-term Figure 1: Schematic of real-time verification processes Figure 2: Web-based interface to verification products Figure 6: FH24 Control minus GDAS+radiances (top) Control minus GDAS+profiles (bottom) Figure 7: FH24 max reflectivity GDAS+radiances (top) GDAS+profiles (bottom) Figure 3: FH00 and FH24 Control minus GDAS Figure 4: FH00 and FH24 Control minus GDAS+radiances Figure 5: FH00 and FH24 Control minus GDAS+profiles Acknowledgements This work was supported by the Developmental Testbed Center. Additional supported provided by the Alaska NASA EPSCoR Program and the Arctic Region Supercomputing Center at the University of Alaska Fairbanks. Special thanks to NASA SPoRT for collaboration efforts during this project, including the provision of real-time AIRS data. Goals Prepare an automated verification system based on MET, providing simple capabilities to compare individual forecasts against observations Perform initial tests on the GSI-assimilation of NASA AIRS data in the HRRRAK model Incorporate the AIRS data into an operational HRRRAK for side by side comparison with the non-assimilated forecasts Figure 11: FH12 control (top) and AIRS profile (bottom) PABR time series Figure 8: Top – Control, GDAS+profiles Bottom - Control minus GDAS+profiles Figure 9: Top – Control, GDAS+profiles Bottom - Control minus GDAS+profiles Figure 10: AIRS profile assimilated, model and observed soundings