Cloud characterization for cloudy radiance assimilation
230 likes | 379 Views
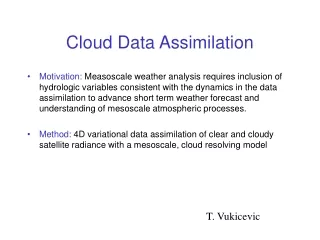
Cloud characterization for cloudy radiance assimilation

Cloud characterization for cloudy radiance assimilation
E N D
Presentation Transcript
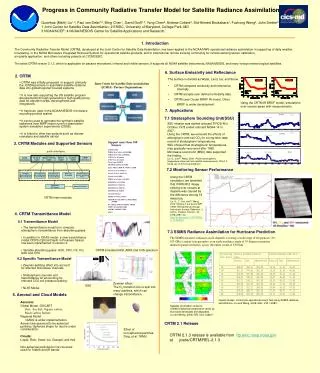
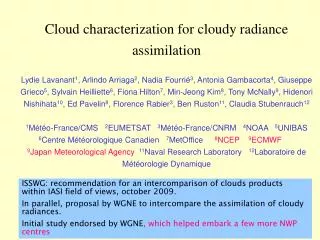
Cloud characterization for cloudy radiance assimilation Lydie Lavanant1, Arlindo Arriaga2, Nadia Fourrié3, Antonia Gambacorta4, Giuseppe Grieco5, Sylvain Heilliette6, Fiona Hilton7, Min-Jeong Kim8, Tony McNally9, Hidenori Nishihata10, Ed Pavelin8, Florence Rabier3, Ben Ruston11, Claudia Stubenrauch121Météo-France/CMS 2EUMETSAT 3Météo-France/CNRM 4NOAA 5UNIBAS 6Centre Météorologique Canadien 7MetOffice 8NCEP 9ECMWF 9Japan Meteorological Agency11Naval Research Laboratory 12Laboratoire de Météorologie Dynamique ISSWG:recommendation for an intercomparison of clouds products within IASI field of views, october 2009. In parallel, proposal by WGNE to intercompare the assimilation of cloudy radiances. Initial study endorsed by WGNE, which helped embark a few more NWP centres
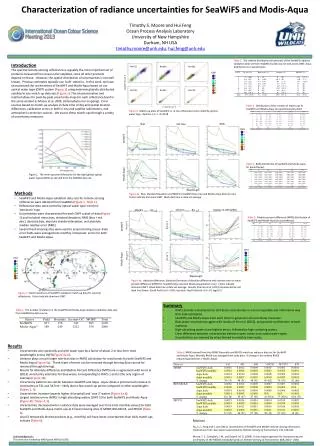
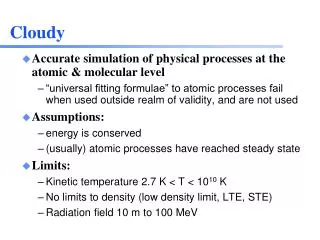
Introduction AIRS spectra Clear observation Cloudy observation Brightness temperature (K) Wave number (cm-1) Infrared signal affected by the presence of clouds. Simulation of channels affected by clouds required (between 75 and 90% of the observations). Cloud parameters (cloud top and cloud cover) required by RT models
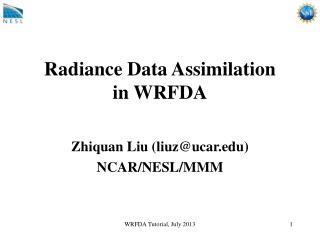
Clear channels Cloudy channels Pressure (hPa) CLOUD Jacobian wrt temperature (K) InNumerical Weather Prediction data assimilation • Clear soudings (all channels) have been first assimilated in NWP. • Clear channels (i.e. Cloud detection scheme of McNally and Watts, 2003: study of the difference between the observation (possibly cloudy) and the simulation from the background computed for clear sky for a subset of channels ranked vertically. • Cloudy channels start being used, after assessment of cloud top pressure and cloud cover (or effective emissivity). obs-background (K) Channels ranked wrt decreasing height Figures from McNally and Watts 2003
IASI Cloud products Intercomparison • Teams: • MF/CMS • MF/CNRM • EUMETSAT • ECMWF (low opaque. 255 sits) • NOAA • CMC • METO • METO oper (cloud amount) • JMA • NRL (clear sit.) • LMD • NCEP • UNIBAS (cloud flag) Rationale: The first step is to detect and characterize the clouds in the footprint of the sounder. One way of investigating the limitations of a particular methodology is to perform a careful intercomparison of the results of different processing schemes for the same observations. Experimental settings: All methods are applied to a 12-h global acquisition on 18 Nov. 2009
IASI Cloud products Intercomparison • Various methods of detection and characterization: • Mainly CO2-slicing methods (CNRM/GMAP, CMC, EUMETSAT, JMA, MF/CMS) • Cloud-clearing method using the 2x2 IASI spots in conjunction with AMSU and MHS (NOAA) • 1D-Var (MetOffice) • minimum residual method (NCEP) • Weighted c2 method (LMD) • Use of AVHRR information (MF/CMS, CMC) • Settings differ: • from 8 channels to 92 channels. 165 for NCEP • 1 reference channel for all channels or couples of channels • And many other differences • single layer cloud or multiple layer (up to 3) clouds (NOAA, MF/CMS) • RT models: RTTOV (from 7 to 9.3), RTIASI, SARTA, 4A, CRTM • FOV to which the method is applied • A priori: NWP forecast or climatology (NOAA, LMD)
Clear positions Clear: cover from AVHRR imager <10% (CMS) ; effective_cover<10% ;
clear/cloudy flag agreement Cloudy: cover>10% (CMS) ; effective_cover>10% ; flagged cloudy (UNIBAS)
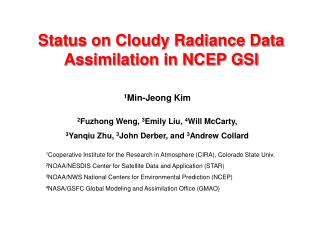
Examples of cloud top pressure over the globe MetOffice NCEP MF/CMS CMC The main meteorological structures have been retrieved by all the schemes but the cloud heights can be very different
Cloud top pressure over Antarctica CNRM LMD Noticeable discrepancies in Cloud top heights.
Examples of Cloud pressure scatterplots CNRM Effective amount Large discrepancies can be observed for small cloud effective amount situations
ECMWF ECMWF outputs provided for detected opaque clouds only
Cloud pressure statistics. All data nb mean / sig (hPa) correlation
Cloud products Intercomparison Distribution of cloud layers Histogram of the differences in cloud effective amount with METO CNRM CNRM
Nb of cloud layers | overcast / opaque single layer Overcast(AVHRR cloud cover >.98) Thick (Tcld) effective amount can be smaller Based on AVHRR clusters and DTcld >1K Opaque: cloud effective amount >.98 1 layer2 layers3 layers
Cloud distribution for single layer situations 66 Overcast thick single layer. CMS definition CNRM 2 peaks, better defined than withall situations
Overcast and « thick » single layer. CMS definition CNRM Effective amount:
Conclusions (1) • The main meteorological structures have been retrieved by all the schemes • Cloud detection: • good coherence between EUMETSAT and MF/ CMS, NCEP, JMA • Cloud heights: • In spite of different retrieval methods, MetO, NCEP, ECMWF, CMC, MF/CNRM and MF/CMS outputs are close • Similar methods lead to similar results (CMC and MF/CNRM); reversely, larger differences come from different methods (CO2-slicing and Cloud-clearing). • Larger differences near the surface: accuracy on Ts and T profile in low levels required • Single overcast and thick cloud layers: • occurrence of these situations is about 50% in this study • Correlations between schemes larger than .95 for these situations • ECMWF overcast/opaque situations often determined with effective emissivity<1 by the other teams. But good coherence in cloud height.
Conclusions (2) • The NOAA scheme often detects and characterizes very high thin clouds above lower clouds which are not seen by the other schemes. • Most RTM models do not calculate cloud microphysical properties: the poor simulation of the observation for high level cloud layers have a large impact in the capacity of assimilating these situations. • Publication: • In special issue of Quarterly Journal of the Royal Meteorological Society • Deadline : mid-November • Have already accepted: MF/CMS, MF/CNRM, ECMWF, NOAA, CMC, METO, METO oper , JMA, NCEP, UNIBAS Proposed future work? • No access to the truth. Could make use of : • Existing collocated dataset of AIRS and CALIOP data • Creation of IASI/CALIOP dataset (Concordiasi…)
CMS AIRS Cloud Mask validation with CALIOP IASI: Cloud height given by AVHRR for opaque clouds (multi-layers) Co2Slicing only applied on fovs with a single layer of non-opaque clouds. For validation, same process applied on AIRS data for granules over MSG disk. Preliminary validation on April 2008, all days and granules (1462). The file incudes coregistered : • Caliop cloud top pressures (2 layers max) • SEVIRI cloud top pressure + cloud type • AIRS Co2Slicing cloud top pressure + emissivity. Ts from ECMWF field • ECMWF analyses
AIRS Cloud Mask validation with Caliop AIRS CALIOP SEVIRI
Cloud Mask validation with Caliop • Bad low level thermal inversion evaluation • Quality control Caliop-Airs: Bias: 18.73hPa Std: 112.21hPa The retrieved cloud is a radiative cloud that may not be in agreement with a physical cloud, specially for thin clouds Preliminary results