Download
1 / 21
210 likes | 405 Views
Maximum Likelihood Estimation for Information Thresholding. Yi Zhang & Jamie Callan Carnegie Mellon University {yiz,callan}@cs.cmu.edu. Overview. Adaptive filtering: definition and challenges Threshold based on score distribution and the sampling bias problem

E N D
Maximum Likelihood Estimation for Information Thresholding Yi Zhang & Jamie Callan Carnegie Mellon University {yiz,callan}@cs.cmu.edu
Overview • Adaptive filtering: definition and challenges • Threshold based on score distribution and the sampling bias problem • Maximum likelihood estimation for score distribution parameters • Results of Experiments • Conclusion
Adaptive Filtering Filtering System Given an initial description of information needs, a filtering system sifts through a stream of documents,and delivers relevant documents to a user as soon as the document arrives. Relevance feedback maybe available for some of the delivered documents, thus user profiles can be updated adaptively.
Adaptive Filtering • Three major problems • Learning corpus statistics, such as idf • Learning user profile, such as adding or deleting key words and adjusting term weights. (Scoring method) • Learning delivery threshold. (Binary judgment) • Evaluation Measures • Linear utility = r1*RR+r2*NR+r3*RN+r4*NN Optimizing linear utility => Finding P(relevant|document) In one dimension: P(relevant|document) = P(relevant|score) • F measure
A Model of Score Distribution: Assumptions and Empirical Justification • Relevant: • Non-relevant: • According to other researchers, this is generally true for various statistical searching systems (scoring methods, Manmatha’s paper, Arampatzis’s paper) Figure 1. Density of document scores: TREC9 OHSU Topic 3 and Topic 5
Optimize for Linear Utility Measure: from Score Distribution to Probability of Relevancy • p: p(r) ratio of relevant documents
Optimize for F Measure: From Score Distribution to Precision and Recall If set threshold at θ:
What We Have Now? • A model for score distribution • Algorithms to find the optimal threshold for different evaluation measures given the model • Learning task: find the parameters for the model?
Bias Problem for Parameter Estimation while Filtering • We only receive feedback for documents delivered • Parameter estimation based on random sampling assumption is biased • Sampling criteria depends on threshold, which changes over time • Solution: maximum likelihood principle, which is guaranteed to be unbiased Figure: Estimation of parameters for relevant document scores of TREC9 OHSU Topic 3 with a fixed dissemination threshold 0.4435
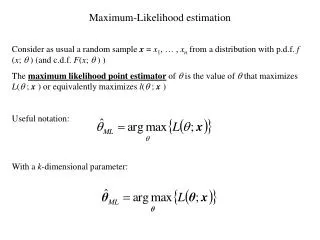
Unbiased Estimation of Parameters Based on Maximum Likelihood Principle (1) ML: the best estimation of parameters is the one that maximizes the probability of training data:
Unbiased Estimation of Parameters Based on Maximum Likelihood Principle (2) For each item inside the sum operation of the previous formula:
Unbiased Estimation of Parameters Based on Maximum Likelihood Principle (3) Calculating the denominator:
Unbiased Estimation of Parameters Based on Maximum Likelihood Principle (4) • For a relevant document delivered: • For a non-relevant document delivered:
Relationship to Arampatzis’s Estimation If no threshold exists The previous formula becomes: • For a relevant document delivered: • For a non-relevant document delivered: Corresponding result will be the same as Arampatzis’s
Unbiased Estimation of Parameters Based on Maximum Likelihood Principle (5) • Optimization using conjugate gradient descent algorithm • Smoothing using conjugate prior: • Prior for p: beta distribution: • Prior for variance: • Set:
Experimental Methodology (1) • Optimization goal (similar to the measure used by TREC9): T9U’=2*Relevant_Retrieved-Non_Relevant_Retrieved=2RR-NR Corresponding rule: deliver if : • Dataset • OHSUMED data (348566 articles from 1887 to 1991. 63 OHSUMED queries and 500 MeSH headings to simulate user profiles) • FT data (210158 articles from Financial Times 1991 to 1994. TREC topics 351-400 to simulate user profiles) • Each profile begins with 2 relevant documents and an initial user profile • No profile updating for simplicity.
Experimental Methodology (2) • Four runs for each profile • Run1 : biased estimation of parameters because sampling bias was not considered • Run3 : maximum likelihood estimation. Both runs will stop delivering documents if the threshold is set too high, especially in the early stages of filtering. We introduced a minimum delivery ratio: If a profile has not achieved the minimum delivery ratio, its threshold will be decreased automatically: • Run 2: biased estimation + minimum delivery ratio • Run 4: maximum likelihood estimation + minimum delivery ratio • Time: 21 minutes for the whole process of 63 OHSU topics on 4 years of OHSUMED data (ML algorithm)
Run 1: Biased estimation Run 2: Biased estimation+ min. delivery Ratio Run 3: Unbiased estimation Run4:Unbiased estimation+min. delivery ratio OHSU topics T9U’ utility 1.84 3.25 2.7 8.17 Avg. docs. delivered per profile 3.83 9.65 5.73 18.40 Precision 0.37 0.29 0.36 0.32 Recall 0.036 0.080 0.052 0.137 MESH topics T9U’ utility 1.89 4.28 2.44 13.10 Avg. docs. delivered per profile 3.51 11.82 6.22 27.91 Precision 0.42 0.39 0.40 0.34 Recall 0.018 0.046 0.025 0.068 Results: OHSUMED Data
Result Analysis: Difference Between Run 4 and Run 2 on TREC9 OHSU Topics Utility: ML - Biased Docs delivered:ML -Biased Topics Topics • For some of the topics , ML (run 4) has a much higher utility than Run 2, while they are similar in most of the other topics • For most of the topics, ML (Run 4) delivered more documents than Run 2
Conclusion • Score density distribution • Relevant documents: normal distribution • Non-relevant documents: exponential distribution • Bias problem due to non-random sampling can be solved based on the maximum likelihood principle • Significant improvement in the TREC-9 filtering task. • Future work • Thresholding while updating profiles • Non-random sampling problem in other task