Last Time
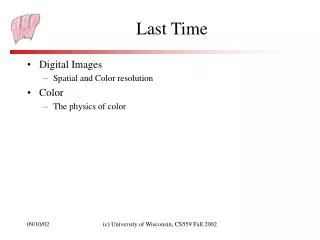
Last Time. Digital Images Spatial and Color resolution Color The physics of color. Today. More on color Color Response Color physiology Trichromacy Color matching Color Spaces. # Photons. Wavelength, λ (nm). 400. 500. 600. 700. Normal Daylight.

Last Time
E N D
Presentation Transcript
Last Time • Digital Images • Spatial and Color resolution • Color • The physics of color (c) University of Wisconsin, CS559 Fall 2002
Today • More on color • Color Response • Color physiology • Trichromacy • Color matching • Color Spaces (c) University of Wisconsin, CS559 Fall 2002
# Photons Wavelength, λ (nm) 400 500 600 700 Normal Daylight • Recall, color is defined by a spectrum, or frequency distribution • We can describe it by a function: E(λ) (c) University of Wisconsin, CS559 Fall 2002
Frequency Response • Any sensor is defined by its response to a spectrum • Expressed as a graph of sensitivity vs. wavelength, () • For each unit of energy at the given wavelength, how much voltage/impulses/whatever the sensor provides • To compute the response, take the integral • E() is the incoming energy at the particular wavelength • The integral multiplies the amount of energy at each wavelength by the sensitivity at that wavelength, and sums them all up (c) University of Wisconsin, CS559 Fall 2002
Sensitivity Wavelength (nm) 400 500 600 700 A “Red” Sensor • This sensor will respond to red light, but not to blue light, and a little to green light (c) University of Wisconsin, CS559 Fall 2002
The “Red” Sensor Response Sensitivity, Sensitivity, 400 500 600 700 400 500 600 700 #photons, E #photons, E Red Blue 400 500 600 700 400 500 600 700 High response Low response (c) University of Wisconsin, CS559 Fall 2002
Changing Response • How can you take a “white” sensor and change it into a “red” sensor? • Hint: Think filters • Can you change a “red” sensor into a “white” sensor? • Assume for the moment that your eye is a “white” sensor. How is it that you can see a “black light” (UV) shining on a surface? • Such surfaces are fluorescent • Your eye isn’t really a white sensor - it just approximates one (c) University of Wisconsin, CS559 Fall 2002
Changing Response • How can you take a “white” sensor and change it into a “red” sensor? Put a red filter in front of the sensor • Can you change a “red” sensor into a “white” sensor? No • Assume for the moment that your eye is a “white” sensor. How is it that you can see a “black light” (UV) shining on a surface? The surface changes the wavelength of the light as it reflects it • Such surfaces are fluorescent • Your eye isn’t really a white sensor - it just approximates one (c) University of Wisconsin, CS559 Fall 2002
Seeing in Color • The eye contains rods and cones • Rods work at low light levels and do not see color • That is, their response depends only on how many photons, not their wavelength • Cones come in three types (experimentally and genetically proven), each responds in a different way to frequency distributions (c) University of Wisconsin, CS559 Fall 2002
Color receptors • Each cone type has a different sensitivity curve • Experimentally determined in a variety of ways • For instance, the L-cone responds most strongly to red light • “Response” in your eye means nerve cell firings • How you interpret those firings is not so simple (c) University of Wisconsin, CS559 Fall 2002
Color Deficiency • Some people are missing one type of receptor • Most common is red-green color blindness in men • Red and green receptor genes are carried on the X chromosome - most red-green color blind men have two red genes or two green genes • Other color deficiencies • Anomalous trichromacy, Achromatopsia, Macular degeneration • Deficiency can be caused by the central nervous system, by optical problems in the eye, injury, or by absent receptors (c) University of Wisconsin, CS559 Fall 2002
Trichromacy • Experiment: • Show a target color spectrum beside a user controlled color • User has knobs that add primary sources to their color • Ask the user to match the colors – make their light look the same as the target • By experience, it is possible to match almost all colors using only three primary sources - the principle of trichromacy • Sometimes, have to add light to the target • In practical terms, this means that if you show someone the right amount of each primary, they will perceive the right color • This was how experimentalists knew there were 3 types of cones (c) University of Wisconsin, CS559 Fall 2002
Trichromacy means… Spectrum Color Matching: People think these two spectra look the same (metamers or monomers) Representing color: If you want people to “see” the continuous spectrum, you can just show the three primaries 400 500 600 700 3 Primaries 400 500 600 700 (c) University of Wisconsin, CS559 Fall 2002
The Math of Trichromacy • Write primaries as R, G and B • We won’t precisely define them yet • Many colors can be represented as a mixture of R, G, B: M=rR + gG + bB (Additive matching) • Gives a color description system - two people who agree on R, G, B need only supply (r, g, b) to describe a color • Some colors can’t be matched like this, instead, write: M+rR=gG+bB (Subtractive matching) • Interpret this as (-r, g, b) • Problem for reproducing colors – you can’t suck light into a display device (c) University of Wisconsin, CS559 Fall 2002
Color Matching • Given a spectrum, how do we determine how much each of R, G and B to use to match it? • First step: • For a light of unit intensity at each wavelength, ask people to match it with R, G and B primaries • Result is three functions, r(), g() and b(), the RGB color matching functions (c) University of Wisconsin, CS559 Fall 2002
The RGB Color Matching Functions (c) University of Wisconsin, CS559 Fall 2002
Computing the Matching • The spectrum function that we are trying to match, E(), gives the amount of energy at each wavelength • The RGB matching functions describe how much of each primary is needed to match one unit of energy at each wavelength • Hence, if the “color” due to E() is E, then the match is: (c) University of Wisconsin, CS559 Fall 2002
Color Spaces • The principle of trichromacy means that the colors displayable are all the linear combination of primaries • Taking linear combinations of R, G and B defines the RGB color space • the range of perceptible colors generated by adding some part each of R, G and B • If R, G and B correspond to a monitor’s phosphors (monitor RGB), then the space is the range of colors displayable on the monitor (c) University of Wisconsin, CS559 Fall 2002
RGB Color Space Color Cube Program (c) University of Wisconsin, CS559 Fall 2002
Problems with RGB • Can only a small range of all the colors humans are capable of perceiving (particularly for monitor RGB) • Have you ever seen magenta on a monitor? • It isn’t easy for humans to say how much of RGB to use to make a given color • How much R, G and B is there in “brown”? (Answer: .64,.16, .16) • Perceptually non-linear • Two points a certain distance apart in one part of the space may be perceptually different • Two other points, the same distance apart in another part of the space, may be perceptually the same (c) University of Wisconsin, CS559 Fall 2002
CIE XYZ Color Space • Defined in 1931 to describe the full space of perceptible colors • Revisions now used by color professionals • Color matching functions are everywhere positive • Cannot produce the primaries – need negative light! • But, can still describe a color by its matching weights • Y component intended to correspond to intensity • Most frequently set x=X/(X+Y+Z) and y=Y/(X+Y+Z) • x,y are coordinates on a constant brightness slice (c) University of Wisconsin, CS559 Fall 2002
CIE x, y Note: This is a representation on a projector with limited range, so the right colors are not being displayed (c) University of Wisconsin, CS559 Fall 2002
CIE Matching Functions (c) University of Wisconsin, CS559 Fall 2002
Qualitative features of CIE x, y • Linearity implies that colors obtainable by mixing lights with colors A, B lie on line segment with endpoints at A and B • Monochromatic colors (spectral colors) run along the “Spectral Locus” • Dominant wavelength = Spectral color that can be mixed with white to match • Purity = (distance from C to spectral locus)/(distance from white to spectral locus) • Wavelength and purity can be used to specify color. • Complementary colors=colors that can be mixed with C to get white (c) University of Wisconsin, CS559 Fall 2002