Download
1 / 76
760 likes | 804 Views
DTDM is a 2D compressible model demonstrating gravity waves, sea-breeze circulations, and more. It's simple, free, portable, and allows script-driven input for easy use in educational settings. While not research-quality, it's perfect for illustrating atmospheric phenomena in a hands-on way. Easily runnable on Unix systems for homework assignments and labs.

E N D
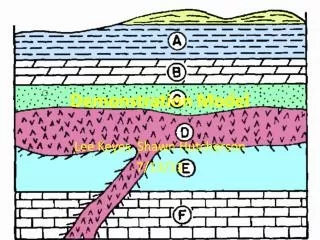
Dynamics and Thermodynamics Demonstration Model(DTDM) Robert Fovell University of California, Los Angeles rfovell@ucla.edu
DTDM is… • A very simple, 2D compressible model • Free, portable: Fortran 77 (g77) and GrADS • Demonstrates gravity waves, sea-breeze circulations, convective rolls, KHI, etc. • Options for including heat and momentum sources, surface fluxes, cold pools, etc. • Input script driven… may not need to modify code
What DTDM is not… • Not a sophisticated model • Second-order numerics, primitive physics • Crude boundary conditions • Not guaranteed bug-free • Not always physically accurate or realistic • Some parameters, processes may be exaggerated for demonstration purposes and/or computational efficiency • Not complete or research-quality
DTDM features • Model prognostic variables: • Wind components: u, w, v (when Coriolis active) • Potential temperature: • Nondimensional pressure: • Environmental settings • Brunt-Vaisala frequency of boundary layer, free troposphere and stratosphere • Up to 3 layers for vertical shear • Latitude (for Coriolis parameter) • Numerical settings • Horizontal and vertical diffusion • Temporal diffusion • Wave speed for open lateral boundaries • Speed of sound
DTDM features • Source terms • Momentum source, configurable as single or repeated, steady or oscillatory • Heat source, steady or oscillatory • Surface heat flux • Sea-breeze-specific heat source • Lower tropospheric cooling zone and/or impulsive cold block • Impulsive thermal • Creates GrADS output
DTDM rationale and use • Demonstrate physical and thermodynamical phenomena with simple simulations • Stills, animations, decomposing forcing fields, etc. • Provide a hands-on package suitable for homeworks, labs • Easily runs on Unix and Unix-like systems (Linux, Mac OS X, Suns, etc.) • Next generation • Web-based? • Implement using WRF? • Namelist input
DTDM home page http://www.atmos.ucla.edu/~fovell/DTDM/ or http://tinyurl.com/nhoj6 Files: DTDM_package.tar [600 KB] DTDM_examples.tar.gz [600 MB, expands to 1 GB] Extract: tar -xvf DTDM_package.tar tar -zxvf DTDM_examples.tar.gz
DTDM package DTDM_package.tar • DTDM_model.f ~ program • storage.txt ~ defines arrays • Makefile • If storage.txt modifed, touch DTDM_model.f and make again • Model input scripts (input_*.txt) • GrADS plotting scripts (*.gs)
storage.txt c max array dimensions parameter(nxm=503,nzm=122,ny=1) ! requires nx <= nxm, nz <= nzm nxm, nzm are max values of horizontal dimensions nx and nz
Makefile # Mac OS X (PPC) with IBM xlf #FC = xlf #FCFLAGS = -O3 -C -Wl,-stack_size,10000000,-stack_addr,0xc0000000 # Linux with Intel compiler #FC = ifort #FCFLAGS = -O3 -convert big_endian # Linux with Portland Group compiler FC = pgf77 FCFLAGS = -O3 -byteswapio SOURCES=DTDM_model.f blktri.f OBJS= $(SOURCES:.f=.o) dtdm: $(OBJS) $(FC) $(FCFLAGS) -o $@ $(OBJS)
How to run • Execute make (executable is dtdm) • Edit input.txt file (many examples included) • First line specifies name of GrADS output • dtdm < input.txt • Output are GrADS control (.ctl) and data (.dat) files
Statospheric gravity waves produced by obstacles (convective cells)Reference: Fovell, Durran and Holton (1992, J. Atmos. Sci.)** **references to my papers illustrate my interest in these phenomena
input_strfcn_isolated_nowind.txt strfcn.isolated.1200sec.nowind 1 byteswap - (1 = if byteswapping needed) 101 nx - number of horizontal grid points - max NXM in storage.txt 84 nz - number of vertical grid points - max NZM in storage.txt 1000. dx - horizontal grid spacing (m) 250. dz - vertical grid spacing (m) 1.0 dt - time step (s) 3600. timend (s) 300. plotting interval (s; min 60 s or time reported wrong by GrADS) Case name used for GrADS files limited to 76 characters, avoid underscores with GrADS
input_strfcn_isolated_nowind.txt 0.01 bvpbl - PBL tropospheric BV freq (1/s) 2000. pbld - PBL depth (m) 0.01 bvtropo - free tropospheric BV freq (1/s) 12000. tropo - tropopause height (m) 0.02 bvstrat - stratospheric BV freq (1/s) 965. psurf - surface pressure (mb)
input_strfcn_isolated_nowind.txt ======================================================= 1 ISTRFCN - turn momentum source on 0 s_repeat - set = 1 for repeated source; 0 for single source 40. s_ampl - amplitude of momentum source (kg/m/s/s) 6000. s_naught - height of source center (m) 10000. s_hwavel - horizontal wavelength of source (m) 18000. s_vwavel - vertical wavelength of source (m) 1200. s_period - period for the momentum source oscillation (s) ======================================================= dtdm < input_strfcn_isolated_nowind.txt
Initial conditions Note: aspect ratio not 1:1
Animation (strfcn_isolated_movie.gs) s_period = 1200 sec For this run: nx = 101, nz = 122 (model top ~ 30 km) Note: aspect ratio not 1:1
Invoking GrADS • grads -l • “-l” requests landscape-oriented window • Opens a GrADS graphics window • GrADS prompt is “ga->” • ga-> open strfcn.isolated.1200sec.nowind • Tab completion works! • ga-> strfcn_isolated_movie.gs • Executes a GrADS script (gs)
Varying oscillation period(strfcn_isolated.gs) Note: aspect ratio not 1:1
Inside a GrADS script(strfcn_isolated.gs) 'set gxout shaded' 'set xaxis 34 64 4' 'set yaxis 10 16 2' 'set clevs -2.5 -2.0 -1.5 -1.0 -0.5 0 0.5 1.0 1.5 2.0 2.5' 'set ccols 49 47 45 43 41 0 61 62 63 65 67 69' 'd thp' 'cbarn 1.0 0 6.0' 'set gxout contour' 'set cmax 2.4' 'set cmin -2.4' 'set cint 0.4' 'd w' 'set mproj off' 'set display color white' * changes aspect ratio of plot 'set vpage 0.5 11.0 0.5 5' 'clear' 'set grads off' 'set lev 10 16' 'set lon 24 74 ' 'run rgbset.gs’ Continues…
Gravity waves Period and frequency Intrinsic frequency & mean flow Tilt angle and stability N Wavelength and wavenumber
Adding flow relative to momentum sourceinput_strfcn_isolated_up4.txt 0. surface wind speed (m/s) 0. vertical shear for first layer (1/s) 8000. thickness of first layer (m) 0.002 vertical shear for second layer (1/s) 2000. thickness of second layer (m) 0. vertical shear above second layer [extends to model top] Shear = 0.002 over 2000 m = ∆U = 4 m/s Shear = 0.004 yields ∆U = 8 m/s
Flow relative to obstacle(period = 1200 sec) U = 0 U = 4 m/s U = 8 m/s Note: aspect ratio not 1:1
Further exploration • Measure phase angles, compare to theory • Perhaps alter plot aspect ratio to 1:1 • Vary source frequency, amplitude, width • Vary environmental stability, wind and wind shear
Obstacle-effect gravity wavesabove convective rolls Reference: Fovell (2004, Mon. Wea. Rev.)
input_strfcn_rolls.txt 0. surface wind speed (m/s) 0. vertical shear for first layer (1/s) 1800. thickness of first layer (m) -0.0036 vertical shear for second layer (1/s) 2500. thickness of second layer (m) 0. vertical shear above second layer [extends to model top] Zero shear below 1.8 km -9 m/s of wind speed difference between 1.8 and 4.3 km
input_strfcn_rolls.txt ======================================================================= 1 ISTRFCN - turn momentum source on 1 s_repeat - set = 1 for repeated source; 0 for single source 0.4 s_ampl - amplitude of momentum source (kg/m/s/s) 1000. s_naught - height of source center (m) 10000. s_hwavel - horizontal wavelength of source (m) 6000. s_vwavel - vertical wavelength of source (m) 0. s_period - period for the momentum source oscillation (s) ======================================================================= s_repeat= 1 for repeated source s_period=0 for steady momentum source
Varying flow above obstacle(strfcn_rolls.gs) u = -3 m/s u = -6 m/s u = -9 m/s Note: aspect ratio not 1:1
Gravity waves excited by heat sources References: Fovell (2002, QJRMS), Fovell, Mullendore and Kim (2006, Mon. Wea. Rev.) Nicholls et al. (1991, J. Atmos. Sci.) Mapes (1993, J. Atmos. Sci.)
input_hsrc.txt hsrc.2mode.no.oscil 101 nx - number of horizontal grid points - max NXM in storage.txt 84 nz - number of vertical grid points - max NZM in storage.txt 1000. dx - horizontal grid spacing (m) 250. dz - vertical grid spacing (m) 2.0 dt - time step (s) 6000. timend (s) 0.00 bvpbl - PBL tropospheric BV freq (1/s) 1500. pbld - PBL depth (m) 0.01 bvtropo - free tropospheric BV freq (1/s) 12000. tropo - tropopause height (m) 0.02 bvstrat - stratospheric BV freq (1/s)
input_hsrc.txt ======================================================================= 1 IHSRC - turns heat source on 0.025 h_ampl - amplitude of heat source (K/s) 3000. h_radius_x - horizontal radius of heat source (m) 3000. h_radius_z - vertical radius of heat source (m) 3000. h_center_z - height of heat source center (m) 0.000 h_freq - frequency for heat source oscillation (1/s) 2 h_modes - number of vertical modes (ndim; max 2) =======================================================================
A simple sea-breeze circulation Reference: Dailey and Fovell (1999, Mon. Wea. Rev.)
Simple sea-breeze strategy • Add a surface heat flux for part of domain (“land”) • Large vertical diffusion as proxy for boundary layer mixing • One use: to investigate effect of offshore or onshore wind on lifting and propagation of sea-breeze front
input_sbf_no_rolls.txt sbf.noroll.nowind 301 nx - number of horizontal grid points - max NXM in storage.txt 26 nz - number of vertical grid points - max NZM in storage.txt 1000. dx - horizontal grid spacing (m) 400. dz - vertical grid spacing (m) 1.0 dt - time step (s) 18000. timend (s) 300. plotting interval (s) 50. csnd - speed of sound (m/s) 100. cstar - lateral boundary wave speed (m/s) 1500. dkx - horizontal diffusion coefficient (m^2/s) 100. dkz - vertical diffusion coefficient (m^2/s) Coarse resolution, large diffusion
input_sbf_no_rolls.txt ======================================================================= 1 ISHFLUX - turns surface heat flux on 12. tdelt - initial ground-air T difference (K) 90 icoast - gridpt location of coastline (0 for all land) 7.2e-3 cdh - effective heat flux coefficient (ndim) 0 irand - impose randomness on surface heat flux ======================================================================= Coastline 90 grid points from left side Large cdh reflects unstable conditions; No imposed random perturbations (irand=0)
Cases Surface wind speed = -3, 0 and +3 m/s
Mean flow effect on sea-breeze(sbf_noroll.gs) 3 m/s offshore No mean flow 3 m/s onshore Perturbation u (contoured) and w (shaded); Aspect ratio not 1:1
Sea-breeze with “rolls” • irand = 1 superimposes random perturbations on surface heat flux • Encourages 2D roll-like circulations • In reality, rolls are 3D organized by along-roll shear • Two-dimensionality provides an (overpowering) organization mechanism • input_sbf_with_rolls.txt
Added horizontal velocity set ccolor 1 set cthick 6 d up
Added airflow vectors set ccolor 1 d u;w
Effect of Coriolis on the sea-breeze circulation Reference: Rotunno (1983, J. Atmos. Sci.)