Download
1 / 15
150 likes | 173 Views
Learn about the history of monitoring, impact of nutrient fluxes, and science needs to comprehend and mitigate hypoxia effects in the Gulf.

E N D
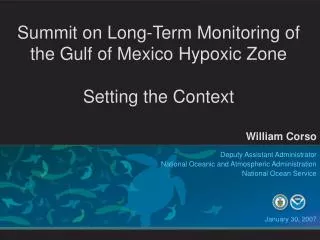
The Need for Sustainable, Integrative Long-Term Monitoring of the Gulf of Mexico Hypoxic Zone Summit on Long-Term Monitoring of the Gulf of Mexico Hypoxic Zone January 30-31, 2007 Alan Lewitus
History of Monitoring • Boesch & Rabalais begin monitoring (1985) • NOAA’s Coastal Ocean Program study documented issue (NECOP 1990-96; supplemental research 1997-1999) – evidence for increasing hypoxic zone over time
Areal Extent of Gulf of Mexico Hypoxic Zone: 1985-1999 2 Area (km ) Rabalais et al.
CENR Conclusions • Hypoxia has increased since the 1950’s • River N load is main driver of hypoxia • NO3 load is > 3X that of 1950’s: 90% of nitrate inputs from non-point sources; 74% of nitrate load is from agricultural non-point sources.
Extension of Monitoring Since mid 1990s, the 5-yr running average size of hypoxic zone has hovered around 15,000 km2 Record = 22,000 km2 in 2002 85 86 87 88 89 90 91 92 93 94 95 96 97 98 99 00 01 02 03 04 05 Rabalais et al.
Areal Extent of Hypoxic Zone – Coastal Goal Metric Areal extent of the hypoxic zone at the peak time of hypoxia (July) has been well characterized and is a good indicator of the intensity of hypoxia in any given year Justić et al. (2002)
Areal Extent of Hypoxic Zone – Coastal Goal Metric UPPER MISSOURI MISSISSIPPI LOWER OHIO MISSISSIPPI GULF OF MEXICO Statistical models suggest that spring/early Summer nutrient fluxes (primarily nitrate) are good predictors of mid summer size of hypoxia Model: Hypoxia area (km2) = 0.0998 x May NOx flux + 672 x Year -13.4 x 10⁵ (R2 = 0.82) Turner et al 2006
Hypoxic Zone Monitoring Justić et al. (2002)
Need for Extension of Monitoring • Action Plan (2001): “greatly expand the long-term monitoring program for the hypoxic zone, including greater temporal and spatial data collection, measurements of macro-nutrient and micronutrient concentrations, and hypoxia…” • Monitoring, Modeling, and Research Workgroup Report (MMR, 2004): “(monitoring) efforts need to be increased in frequency, at a minimum monthly from May through September. To develop a more complete understanding of ecosystem dynamics, selected sites should be monitored year-round. The spatial boundaries of some of these existing monitoring efforts should be expanded to collect data for defining boundary conditions in modeling efforts."
Science Needs • Causes of Hypoxia: • Expansion of spatial boundaries • Greater temporal resolution DiMarco et al. (2006); image from N. Walker
Science Needs • Causes of Hypoxia: • Benthic processes • Hypoxic volume
Science Needs Impacts of Hypoxia: • Hypoxia effects in the Gulf are: • Indirect • Spatially-mediated responses to the environment • Occur across multiple trophic levels • Need to trace effects of habitat loss through the food web to understand ecosystem-level effects
Hypoxia Effects on Atlantic Croaker Distribution Moderate Hypoxia (1983, 1987, 1988, 2000) Severe Hypoxia (1993, 1995, 1996, 1997) ~33-50% habitat loss from K. Craig
Scavia et al 2003, 2004 20000 15000 2 Area (km) 10000 100 5000 80 60 0 % Increase in Oxygen 10 20 30 40 50 60 40 N Load Reduction 20 Bierman et al 1994, 1999 0 10 20 30 50 70 % Nitrogen Load Reduction Science Needs • Support models used to: • quantify the relationship between nutrient loading and hypoxia • understand the causes of hypoxia • understand the impacts of hypoxia Hetland – ROMS model Justic et al. (1996)