Download
1 / 36
360 likes | 382 Views
This independent study investigates the potential effects of the oceanographic environment on port security in the Mid-Atlantic region. Using modern observational resources, the study aims to understand how estuarine dynamics and physical forces impact port operations. By examining extensive datasets and numerical modeling, the study seeks to improve the accuracy of predicting ocean conditions and prioritize potential impacts on port security.

E N D
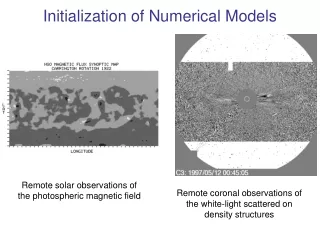
Independent Study: Exploring the Potential Effects of Oceanographic Environment on Port Security in the Mid Atlantic The Mid Atlantic is one of the most well sampled coastal oceans in the world. It is also the site of the Department of Homeland Security Center of Excellence for Port Security. I propose to use the modern observational resources of the Rutgers Coastal Ocean Observatory Lab to explore the potential effects of the ocean environment on port security. The mid Atlantic includes three major estuaries which include Chesapeake, Delaware, New York Harbor and their associated ports. Port Operations in Chesapeake are dominated by Navy, in Delaware by oil, and in New York Harbor by Shipping. All three depend on the physics of the interactions between the rivers and the coastal ocean that occur in the estuaries. Estuarine dynamics have significant impacts on port operations due to the transports of water and the varying densities. Further understanding of different flow rates, salinity levels, along with applying work and energy principles will help further understand the motion and directions of the seas. Current models for port operations do not contain physically realistic representations of the oceans estuarine dynamics. By examining the new extensive datasets available in the Coastal Ocean Observation Lab with the advisement of Dr. Scott Glenn, I will try to determine how the estuaries respond to physical forces (storms, heavy rain, wind) and which of those responses can have an impact on port operations and security. These impacts can then be prioritized for inclusion in port operation models.
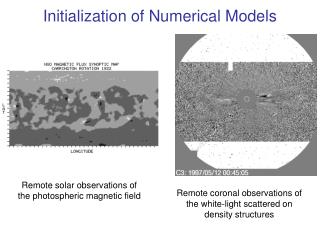
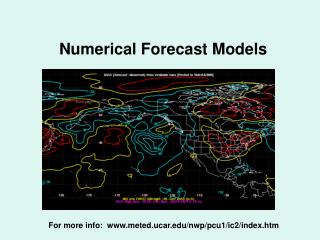
How Numerical Models Predict the Ocean • Every particle in the ocean is tracked through time by a three dimensional resultant force vector, which is computed by taking the resultant of all forces acting upon a single particle. • Through Newton's Law F=ma scientists can track the direction and the amount of mass transit of water through the ocean by accurately predicting the resultant force on a single particle • The main forces under consideration include, the barometric force or atmospheric pressure, the wind force or wind stress acting upon the surface of a body, the Coriolis Force and Pressure Gradient Force contributing to the mass horizontal movement of the particle across the water. • Each particle has distinct characteristics of mass, % salinity and heat which allows for the model to predict salt, mass and heat transport of ocean • Thus Models can predict the dynamic changes of salinity, temperature and water level changes in a geographic location by predicting and accounting for individual partials of mass in the ocean and determining the momentum and direction of the mass as of each particle as it flows throughout time.
How Numerical Models Predict the Ocean • The dominate force balancing is the Geostophic force balance between the Pressure Gradient and the Coriolis Force. The Pressure Gradient is determined by the pressure field and the Coriolis Force is dependent on the longitudinal position. • It is important to understand further these two forces as they determine the direction the water will flow. • Under simplified conditions we can assume that the Coriolis Force is equal to the wind stress and perpendicular to the velocity that the water is traveling. This can be considered when looking at the deflection of a slow moving object or particle over a long period of time. • By determining the magnitude and direction that each particle flows with greater accuracy the errors in predictions would decrease significantly!
Numerical Modeling Today • In the past these models have not been reliable and have been wrong more times than they have been right. • Since these models have proven to be unreliable scientists did not see the predictions being comparable to real life and thus did not use the new technology for warnings during floods, storm surges and other situations to which put people and ports at danger. • The NYHOPS model, which is located on the Stevens Institutes Web page has gone through many modifications and has started to become and integrated tool in forecasting the Hudson Riverarea. • It is our study to figure out at what times the model has a large amount of error in its predictions. Through this analysis the model can be adjusted in order to perform a greater level of accuracy.
NYHOPS Model NYHOPS : Numerical Model which predicts the Salinity, Water Level and Temperature in New York/ New Jersey Harbor The New York/ New Jersey estuary has many streams of water flowing into it. Mainly it is the flow of water from upstate New York and the Atlantic ocean that contribute to the mass transit of water coming into the estuaries. NYHOPS Model Lies on these assumptions • Momentum is conserved F=d/dt(mv) • Heat Content is conserved (Change in Temperature) • Salt Content is conserved-(Salt in=Salt out) • Mass is conserved- (Fresh water in=Freshwater out)
Storms • Storms affect the oceans as they create a force known as wind stress on the surface layers. This force contributes to the direction that the ocean moves. • Other Forces non-astronomical forces are amplified during a storm • When cold and warm water come in contact with one another a high and low pressure system, creating the ingredients for a storm to occur. • In the ocean water moves from higher pressure to lower pressure. This force is known as the Pressure Gradient Force
Prediction • My prediction is that during storms and mass amounts of rainfall the NYHOPS Model will have more Uncertainty in the Resultant Response vectors than under temperate conditions • This can be seen by comparing the actual Resultant Response Vectors provided by Rutgers CODAR data and the Stevens, NYHOPS Models predicted vectors
Storms of NYC Past • Before looking at NYHOPS model, I found it interesting to look at other models and storms to see the error in past models predictions differ between temperate condition and extreme weather conditions
Tropical Storm Barry Hits NYC J une4, 2007 Storm Begins
Storm Causes Uncertainty Storm Begins Storm Ends Greater magnitude of error and variation Greater additional contribution to sea level due to non-astronomical forces during the storm
Hurricane Eresto Winds Cause Storm Surge Date: September 2,2006 Storm Begins Hurricanes cause forces in the ocean to amplify making ocean movement and unpredictability greater!
F orcesIn the Ocean • Under Temperate Conditions the astronomical predictions and the actual observations for sea levels correlate. During these days the flux of water in the ocean is mainly due to astronomical forces • During Storms or Hurricanes: F orces amplify • Making it hard for predictions to be made • Additional forces other than astronomical forces are amplified, causing a difference in the astronomical and actual sea levels
Test of My Predictions Dates • North Eastern: October 14th-15th • Temperate Day: November 25th-2 6 th
Summery of Oct.14th North Eastern • Storm Hits NYC at around 6:30pm on the 14th • Heavy Rainfall from the South West covers the area till Midnight, precipitation up to1.5 inches • The storm continues to bring heavy rainfall intensifying up till noon of the 15th • The storm slowly moves towards the NE leaving light rainfall during the evening hours • NY/NY Strengthening northeast winds on the front side of the storm and will be hit with the north to northwest winds on the back side, almost like the passage of a hurricane in the tropics, or the wake of a midwinter storm • Pressure dipping to 975mb brought high winds and Gusts of 50 mph strong enough to nock down trees, lead to sporadic power outages and toss your trash cans!
Errors in Prediction Models for Sea LevelsComparison of NYHOPS V.S. NOAADate:14-15 October 2010 Actual Data :NYC Battery Tide Gauge Storm Hits 18:30 G MT Error : (Gauge-model) Time in GMT
Conclusion • NYHOPS Model predicts the tide well with minimal variation and small error • NYHOPS Model error did not significantly change during the storm • NOAA model has both higher variation in tide predictions as well as higher error when compared to the NYHOPS model • NOAA model has considerably higher error during the storm then before the storm hits!
Directionality Measure: Comparison of Resultant Vectors CODAR vsNYHOPS Model • With kind help from Mr. Mike Smith and Nickitas Georgas, we have overlaid CODAR vectors and NYHOPS Model prediction vectors in Google Earth • Observing the difference in directions of the two different data sets we can begin the first step in validating the NYHOPS model
Methodology to Observing • Took four Geographic Places of Interest to observed • Ranked the correlation of CODAR data to the NYHOPS model data through angle to which the two vectors were off from one another. • 0: 16 0-180 degrees off • 1: 159-120 degrees off • 2: 119-90 degrees off • 3: 89:7 0 degrees off • 4: 6 9: 50 degrees off • 5: 49: 0 degrees off
CODAR • The CODAR has a radial coverage: 7 5minutes • Radial output: 30 minutes • The sites that Rutgers owns are 25MHz with 12 meter radio waves and ketch waves either towards or away from the sites which are 6 meters in length. Data cannot be collected at water depths bellow 3 meters. • CODAR is a radar system used to determine the speed, direction and distance of waves away from the radar admitter. There must be a deflection in order to determine the speed and direction of the wave which supplies scientists with this data. • CODAR vectors missing between two sites means that the CODAR was taken out of the vector map because a third site being down. This third site is needed in order to determine with certainty the vectors direction. • Difficulties on Analysis of October 14th storms due to Stevens’sinstitute site being down caused this gape between the remaining Rutgers sites . The dates of the 25th was picked because Stevens site was running on this day giving a full vector map for study.
CODAR • CODAR maps are generally generated using a mathematical algorithm which weights different sites outputs and compiles the data into a net vector which has been used to do the comparison of the NYHOPS model and the CODAR data. If the components of the resultant vector are orthogonal to one another they are ranked with the most certainly. As discussed above the vectors which are not mapped have enough uncertainly or missing weighted components from down sites that they are misleading to interpret or map and thus are removed from the observations. • The CODAR data are vectors of three hour averages in which the vector for example 12am is the average of 9pm-12am.
Analysis of the CODAR DATA v.s. NYHOPS • Mainly the direction of vectors away from the bay area closer to correlate well with one another • The Long Island Coast was another area which was observed for these dates seem to be of some concern as there was at least 100 degrees between the CODAR and model vectors 40 % of the time intervals and at least 90 degrees 6 5 % of the intervals. • Sandy hook, Rockaway and Breezy point all lack data and have no observations at least 50 % of the time and thus any comparison at this point relating the model and the CODAR data would lead to limited and even lead to misleading conclusions. • There is a lot of variation in the errors in the Sandy Hook region and thus area should be further investigated
Analysis of the CODAR DATA v.s. NYHOPS • During the changing of the tide the comparison of the vectors going into the estuary in the CODAR data completely appose the NYHOPS model. The NYHOPS model seemed to have a delay in changing vector directions with the tides • After the storm hits at 6:30pm the direction of vectors out to sea had a higher differences between the two data sets • In addition after 6:30 the direction of water going into the estuary itself between the two data sets had significantly differences in vector directions, majority of the time spanning at least 120 degrees apart! • The CODAR Data was consistent with the changing tides
Observations for 25th -26th • During the Changes of the tides the Model Changed slowerthan the CODAR data leading to completely opposite directionality, the change over time for the model was minimal! • During non transition periods of water into the estuary the Model and the CODAR data correlated very well, with a few problems in directionality. Vectors were off by less than 45 degrees!
Observations for 25th -26th • Vector Analysis near Sandy Hook was minimal but there was moderate correlation in the vectors in the area. Most vectors were between 45-90 degrees from one another • Rockaway Point, Breezy Point and Long Island Areas continued to lack CODAR data which brings up concerns for these areas.
NYHOPS Model and CODAR Correlate Time:21:54 Peak Low Tide Red=CODAR White= NYHOPS Model
NYHOPS Model and CODAR DON’T Correlate Time:15:54 Changing of the Tide Red=CODAR White= NYHOPS Model
NYHOPS Model and CODAR DON’T Correlate Changing of the Tide Time: 09:54 on 26 th Red=CODAR White= NYHOPS Model
Comparing the Model Problem Areas • Breezy Point and Rockaway Point: Hardly had CODAR Data to do analysis on so conclusions were minimal and lacked certainly • Sites which were down lead to uncompleted CODAR Map • Vectors near the coastal areas such as Long Island did not consistently have correlation between the vectors • Sandy hook areas were also not consistent but seemed to correlate better when the tide was moving in rather than out
Problems Encountered During the Study • CODAR Site down • Missing Vectors In CODAR DATA • Different time correlations GMT time verses EST
Conclusion Movement of surface currents is a particular interest to scientists as the oceans are much wider than they are deep: The NYHOPS model Seems to be good at predicting sea levels even when storms occur Model Predictions directionality seem to be far more accurate in Temperate Condition then in extreme weather conditions
F utureStudies • I would like to conduct a Statistical test on the vectors in order to determine the problem areas to which the model and the CODAR data do not fit with one another. The performance measure for this test will be the distance between the CODAR Vector position and the models predicted value. The question is to see if: • The null hypothesis H0: u1-u2=0 The vector position are not statistically significantly different from one another • The alternate hypothesis H1: u1-u2≠0 The vectors position is statistically significantly different from one another in a certain area. This will indicate that the CODAR data and the model prediction vectors are statistically significantly different from one another.
F utureStudies • It is important to use blocking for this test since the ocean is dynamic and the model may correlate with the CODAR data in some areas and not in others. We are interested in determining where the model and the CODAR data fail to match with one another and why. Areas which do not have adequate CODAR data due to technical difficulties will not be tested at this point. • The test will be based on computing sample standard deviation since we do not know the true population standard deviation. And thus the test statistic will be t. We will do the test with 95% confidence and thus if alpha is equal to .05. If the p value is less than .05 we can conclude that there is a statistically significant difference between the model and the CODAR vector direction. • Thus, when the test deems to be significant this indicants areas for further investigation of both the model and the CODAR vectors