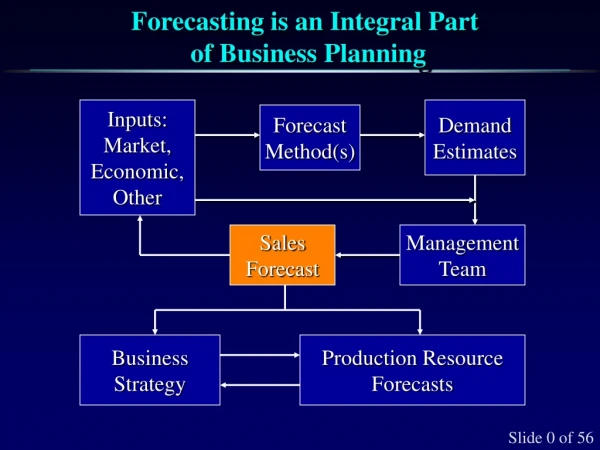
Developing an Integrated Forecasting Model for Third Generation Mobile Business Planning
470 likes | 484 Views
Developing an Integrated Forecasting Model for Third Generation Mobile Business Planning. Coleago Consulting Ltd IRR Conference - London, UK - October. Stefan Zehle & Graham Friend, Coleago Consulting Ltd, 47 Holland Park, London W11 3RS, UK

Developing an Integrated Forecasting Model for Third Generation Mobile Business Planning
E N D
Presentation Transcript
Developing an Integrated Forecasting Model forThird Generation MobileBusiness Planning Coleago Consulting Ltd IRR Conference - London, UK - October Stefan Zehle & Graham Friend, Coleago Consulting Ltd, 47 Holland Park, London W11 3RS, UK Tel: +44-7974-356258 e-mail: stefan.zehle@coleago.com
Agenda • Introduction to Coleago Consulting Ltd • Forecast objectives • The marketing forecasts • Capex and opex • The financial result • A practical demonstration
Coleago’s consultants have worked on mobile projects in 28 countries. • Coleago’s consulatnts have advised clients with regards to all issues of mobile business development including demand assessment, tariffing, positioning, interconnect, coverage roll out, business planning, market forecasting, etc. • We have carried out market studies and advised clients on licence bids, business planning, due diligence, acquisition evaluation, etc. Austria, Belgium, Denmark, Finland, France, Ireland, Italy, Netherlands, Norway, Poland, Sweden, UK Canada Israel, Kuwait Caribbean, El Salvador, Mexico Australia, China, Hong Kong, Korea, Malaysia, Taiwan, Singapore Argentina, Brazil, Venezuela
Typical forecast objectives. • Produce a valuation for a 3G mobile business: • Bidding for spectrum • Mergers and acquisitions • Investment appraisal • Strategic planning • The forecast must be presented in form of a spreadsheet model to to enable the running of sensitivities and scenarios. • The forecasting methodology and model must deliver results quickly and must be easy to use, while also producing excellent quality of analysis. • The valuation is the key output.
Main forecast outputs required. • Penetration & total subscribers • Customers, gross adds, churn • Voice, data and other revenues • Traffic forecast • Costs • P&L, balance sheet and valuation
Marketing Model Engineering Model Model Finance Model Business planning involves teams from three key areas and this should be reflected in the model design. • Marketing is responsible the revenue side and must also produce a traffic forecast. • The engineering model must translate the traffic forecast into a network plan and generate the capex and opex numbers to be passed to the financial model. • The financial model takes in information from marketing, including key metrics, revenue forecast, acquisition costs and capex, opex from the engineering model.
The main objective of the marketing model is to produce revenue and traffic forecasts. • The demand forecast should be set against the total market and “tell the story” in a plausible way. • The model should focus on the fundamentals and avoid unnecessary detail, such as: • Detailed voice tariff plans are not required, what is needed is the average voice revenue per customer and the average revenue per minute. • For data is is not necessary to make detailed assumptions on what users do, all that is required is a revenue forecast and a traffic forecast broken down into delay tolerant and constant bit rate data. • Key trends should be trackable, for example average revenue per minute, per Mbyte, bandwidth demand, and ARPU.
The marketing forecast is based on a few key parameters that area easily benchmarked and communicated. • Total market penetration and installed base • Churn and gross additions • Market shares • 3G enabled customers • Voice service revenue and tariffs • Data services revenue and tariffs • Voice minutes of use • Data traffic • Cost of customer acquisition
Essentially the equation is how many customers are there and what does the mobile operator has to deliver for the money paid by those customers. How many customers do we have? Revenue Forecast How much are they willing to spend? Traffic Forecast What are our tariffs?
Potential demand is a sub-set of the addressable market. Example of a developing country: Total Population 100% 50% With Sufficient Income 60% Old Enough to Own Mobile Phone Addressable Market 30% 80% Expresses Interest: Potential Demand 24% of Population
Potential demand for mobile operators must be backed by willingness and ability to pay. • All those who are interested and who are also willing and able to pay a minimum amount. • Demand is demand in the economic sense, because it is backed by willingness and ability to pay. • Some people, regardless of price have no interest in mobile. • Maximum potential demand ceiling is likely to change over time due to the bandwagon and age shift effects. • Looking at the propensity to adopt by age provides a window to the future. • Factors other than age are important, in lower income countries income is a discriminator.
Propensity to adopt mobile by age - example from Western European country: Age is an important discriminator. A Western European country, sample 1,000 interviews 1997
Correlation between propensity to adopt mobile & income - example high income country: Income does not matter. A Western European country, sample 1,000 interviews 1997
Correlation between propensity to adopt mobile & income - example lower income country: Income matters. A Far Eastern country, sample 1,500 interviews 1996
60% Potential Demand Ceiling 50% 40% Penetration of Population 30% Penetration 20% 10% 0% 1990 1991 1992 1993 1994 1995 1996 1997 1998 1999 2000 2001 2002 2003 2004 2005 2006 2007 2008 Maximum potential demand assumptions for each segment should be anchored in consumer and business demographics. • Segmentation must be appropriate to long term forecasting. This may not be the same as segmentation for other purposes. • The potential demand assumptions should be linked to changing demographic patterns and changes in income. • The potential demand sets a penetration ceiling, conceptually the maximum potential penetration is the level at which the product life cycle curve reaches its upper limit.
Equally, the potential demand for mobile data services, such as 2.5 / 3G mobile Internet access can be researched. • In high income countries demand for mobile Internet access is highly correlated to age.
The revenue per customer is based on willingness to spend. • Customers area prepared to pay for applications, i.e. an amount for voice and an other for data, for example Internet access. • The forecast is based on willingness to pay rather than forecasting usage. This means demand is anchored in an economic context, for example it can be researched and benchmarked against household income or spend per seat for business customers. • The traffic forecast is a function of the value proposition in terms of the voice and data tariffs, i.e. what does the customer get for the money. • Traffic is not an input but an output that is calculated by taking the amount people are prepared to spend and dividing it by the effective per minute tariff for voice and for data by the price for bandwidth and volume.
One has to understand how much customers are will to spend. This can be based on research and empirical data. • Measuring price elasticity of demand with regards to monthly cost of ownership for potential users is based on Van Vestendorp approach to price elasticity testing: “What is the highest price which you would consider paying in respect of your average monthly bill?” • Most respondents think in monthly budgets rather than minutes of use, the monthly budget is in effect the monthly bill a new mobile subscriber is prepared to pay. • From an analysis of the data points the relationship between the monthly bill marginal subscribers are prepared to pay and penetration of maximum potential demand can be derived and expressed as mathemathical function.
Price elasticity of demand empirical evidence: Demand is driven by the value proposition, minutes for an amount of money.
Marginal voice bill forecast as a function of penetration of potential demand - example high income country. A Western European country, sample 1,000 interviews, 1997
Researching willingness to spend for 3G data services yields similar classic price elasticity of demand curves.
The average monthly voice bill is forecast using a variety of parameters. • The starting point is the current average monthly bill in the market. • The average monthly bill forecast is the current average monthly bill plus the sum of marginal bills. • Adjust for price elasticity of demand for existing subscribers - how do they react to tariff changes. • Output is a forecast of the average monthly bill as a function of the penetration forecast. • A particular venture’s forecast of the average monthly bill should be in line with the market average, but there can be differences to compensate for other elements of the marketing mix.
Empirical evidence of price and minutes of use demonstrates that traffic can be forecast as a function of willingness to spend and tariffs.
Price elasticity of demand of existing subscribers has to be modelled using price elasticity coefficients. • Conventionally the price elasticity coefficient indicates the effect a change in the price of a good will have on the quantity demanded. • In the Coleago model the price elasticity coefficient is applied to the monthly bill instead of quantity demanded. • Values for the price elasticity coefficient are similar to the conventional method, it is essentially the same concept. • Avoids some of the complexities (e.g. different elasticities for line rental,. call charges, etc.) and produces a good result. • Use benchmarks to determine coefficients.
The voice traffic forecast in minutes of use is based on spend and tariffs. • The average monthly bill forecast divided by the average per minute price produces the average number of minutes per month per subscriber. • Decline in tariff will drive increase in usage. • Price elasticity also depends on mobile tariff relative to fixed. Substitutional usage is generated as people start using mobile as primary phone. • Fixed voice minutes are higher than mobile minutes (400 per line/month is Europe, 1,000 in USA). • Based on benchmarks the % split outbound vs. inbound traffic, international calls, roamed calls can be determined.
Average monthly bill and mobile originated minutes forecast result based on survey & forecast model.
The speed at which data is transmitted will be the main service attribute by which users judge GPRS and 3G mobile Internet access services. • Packet data services are “always-on” services. This means the concept of “making a call” no longer exists. Tariffs will not be based on minutes or time connected. • What users will buy is the ability to send data at “high speeds” of at least 64 kbit/s and up to 384 kbit/s with 3G. • The bandwidth available to customers and the volume of data impact on network dimensioning. The forecast must establish a data services value proposition which is defined in terms of the access bandwidth (kbit/s) experienced by users and the data volume (Mbytes) per month. • Measures such as Mbytes and bandwidth per customer per month are key metrics.
Conjoint analysis carried out in Belgium showed that potential 2.5/3G users are prepared to pay more for higher download speeds. Blue: 64 kbit/s for 25 Euro/month Silver: 128 kbit/s for 50 Euro / month Gold: 256 kbit/s for 100 Euro / month
Based on willingness to spend for access bandwidth the take-up of data services can be forecast.
Given the traffic forecast, the price per Mbyte can be calculated.
The engineering model covers capex and opex for 2G and 3G networks. • The capex and opex part of the 3G Mobile Toolkit covers the technical aspects, including capital and operational expenditures. • The scope of the 3G engineering model includes dimensioning and costing for the following elements: • Radio network • Core network & interconnect • Server network
A flow chart menu provides a clear structure to the capex and opex forecast and guides the user through the model.
The traffic data from the marketing model drives network dimensioning. • Because the model is intended to be used in the business-planning phase, it is essential that a range of scenarios can be evaluated rapidly. • The impact of varying, for example, different tariffs can be calculated instantly. • The engineering model can run completely in the background so that business planners can run scenarios without recourse to engineering.
The financial model links directly into the marketing model and covers all financial aspects. • Capturing all the detail of the customer base dynamics, the financial model allows the most comprehensive and rigorous approach to forecasting the cost base and ultimately a valuation. • The financial model outputs are those used by decision makers at board level and the financial community. • The presentation pack produced by the financial model provides a complete business case, which takes the reader from an analysis of the population through to a range of valuations. • The valuation of the business case is the ultimate objective of the suite of models.
Profit & Loss Cash Flow Balance Sheet The model combines inputs from the marketing and the engineering models with operating cost assumptions to forecast the financial statements and free cash flow. Engineering Model’s Network Opex and Capex Forecasts Market Forecast Model Operational Structure, Distribution Channels, Staffing etc. Customers and Revenue Forecasts Business Planning Model Operating Cost Assumptions Network Capex and Opex Forecast All figures in Nominal Local Currency Free Cash Flow in Nominal Local Currency (Operating Cash Flow less Capital Expenditure)
The free cash flow is discounted to a net present value and combined with a terminal value to give the enterprise value. Free Cash Flow in Nominal Local Currency Converted to the Selected Currency Free Cash Flow in the Selected Currency - Nominal Deflated to a Real FCF Series Free Cash Flow in the Selected Currency - Real Discount to a Net Present Value Net Present Value Terminal Value Enterprise Value
The model incorporates six valuation approaches. Discounted Cash Flow (DCF) with a Terminal Value Growth Rate • Discounted Cash Flow with an EBITDA Exit Multiple Enterprise Value (EV) per Subscriber • Enterprise Value per Pop Enterprise Value / EBITDA Enterprise Value / Sales
P/E Ratios As mobile businesses are often loss making in the early years a discounted cash flow approach to valuation is frequently the most appropriate methodology. Per Pop and Per Sub EV / Sales Earnings EV / EBITDA Time Discounted Cash Flow Valuation
The valuation results are presented graphically in the executive summary.
Comparisons can be made with up to twenty other mobile companies in each of the following areas: Price / Earnings • Price / Earnings v 5-Year CAGR Enterprise Value / EBITDA • Enterprise Value / EBITDA v 5-Year CAGR Enterprise Value / Sales Dividend Yield Price / Cash Flow Per Share Price / Net Book Value
An extensive printing menu, allows the production of an impressive business plan at different levels of detail.
Conclusion • One coherent assumption set drives the business plan and valuation. • Scenarios can be run easily and questions can be answered in minutes rather than days. • The integration of the three models – marketing, engineering, finance – encourages team working and better understanding. For example, marketing can see instantly what effect a 20% cut is tariff has on valuation.
Visit our website to obtain further information. • You can obtain other Coleago conference papers and articles from our website. www.coleago.com