Download
1 / 22
220 likes | 393 Views
Use of Data in Culturally Responsive PBIS. Andreal Davis, Kent Smith Wisconsin RtI Center/PBIS Network Exemplar presenters: Jessica Grandt-Turk, Lindsey Krueger Harrison Elementary School, Janesville, WI. Whatever you see in a child is what you will produce –

E N D
Use of Data in Culturally Responsive PBIS Andreal Davis, Kent Smith Wisconsin RtI Center/PBIS Network Exemplar presenters: Jessica Grandt-Turk, Lindsey Krueger Harrison Elementary School, Janesville, WI
Whatever you see in a child is what you will produce – “I don’t become what I think I can; I don’t become what you think I can; I become what I think YOU THINK I can.” "Educational researchers have proven time and again that culturally responsive teaching methods increase student engagement. So if our teaching is not culturally relevant, then we as educators are not relevant." - Chike Akua
Agenda • Setting the stage: State of Discipline in our schools • What are Culturally Responsive Practices and how do they fit in a Multi-level System of Support • Harrison’s Story • Q&A
“Students w/ disabilities are almost 2x as likely to be suspended from school as nondisabled students, w/ the highest rates among black children w/ disabilities.” NYTimes, M. Rich Aug 7 2012 • >1 Susp. 1 Year • 1 in 6 black • 1 in 13 Amer Indian • 1 in 14 Latinos • 1 in 20 Whites • Not correlated w/ race of staff • 13% w/ v. 7% w/o • 1 in 4 black K-12 students • High suspension correlated w/ • Low achievement • Dropout • Juvenile incarceration Dan Losen & Jonathan Gillespie Center for Civil Rights Remedies at UCLA
Who is getting pushed out?(Dignity in Schools Campaign, retrieved July 14, 2013) • Expulsions Nationally • Black Students 3.5x more likely to be expelled than white students • Latino/Latina students 2x more likely to be expelled than white students. • American Indian students 1.5x more likely to be expelled than white students • LGBTQ students 1.4x more likely to be expelled than heterosexual identified youth • Students in foster care 3x more likely to be suspended or expelled than students living with parents or guardians. • Youth who do not finish High School are 8x more likely to be incarcerated.
In Wisconsin • Exclusion • African American students are 7x more likely to be suspended than white students • American Indian students are 5x more likely to be suspended than white students • Latino/Latina students are 3x more likely to be suspended than white students • In 2010, there were 14,241 students who started school in 2006 that did not graduate.
Data is NOT a 4 letter word • The data analysis and disaggregation do NOT “fix” the underlying system, but helps us identify the problem. • Once the problem is identified, precision statements can be written to guide the work. • So how does data guide culturally responsive practices?
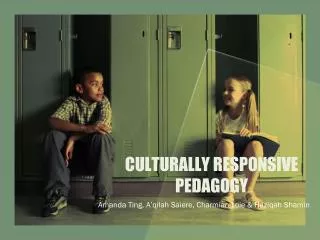
Culturally Responsive Practices • Race, language and culture are significant to the way RtI works
Principles of RTI • The belief that all students can and will learn. • The belief that our instruction should meet student needs. • The belief that the actions we take as educators can impact student learning. • The belief that using data can assist us in making sound instructional decisions.
Where Can I…? • Validate • Affirm • Build • Bridge
Includes factors that influence: • Identities • Thinking • Beliefs • Behaviors Source: WI RtI Center, Culturally Responsive Practices Glossary Culturally Responsive Practices: • Gloria Ladson-Billings (UW-Madison) coined the term “cultural relevancy” in 1994. It is a way of teaching that “empowers students intellectually, socially, emotionally, and politically by using culture to impart knowledge, skills, and attitudes.” Key components of culturally responsive practices are: • teachers who are culturally competent about their students’ cultural beliefs and practices; • teachers who think of all of their students as capable learners, have high expectations for them, and help the students set short and long term goals for themselves; • teachers who know each student and draw on the students’ own experiences to help them learn; • teachers who have a wide variety of teaching strategies and skills to engage the students; • teachers who can help the students deal with the inequitable treatment of students of color and other underserved populations by helping them become critically conscious and knowledgeable about the students' culture; and • teachers who can create a bridge between the students’ home and school lives while meeting district and state curricular requirements.
Schools that areCulturally Responsive: • Have a set of values and principles that recognize diversity; • Demonstrate behaviors, attitudes, policies, and structures that enable them to work effectively cross-culturally and value diversity; • Conduct self-assessment to ensure sensitivity to cultural characteristics; • Are committed to manage the “dynamics of difference; • Learn about and incorporate cultural knowledge into their practices; and • Adapt to diversity and the cultural contexts of the communities they serve.
Using Data • Risk Ratio – Shows relative risk of a group of students in a building for getting a particular educational outcome.
Risk Ratios: System and Student Outcome • Risk Ratio is based on disaggregated ODR and suspension data • To calculate it: • % of subgroup enrollment with an outcome (ODR, Suspension, etc) • Divided by • % of white enrollment with same outcome • i.e. 85% of Latino/Latina students received ODR • --------------------------------------------------- • 42.5% of white students received ODR • Risk for white students is 1.0; ratio below 1.0 decreased risk, ratio above is increased risk
Solutions • Once need is identified, plan for what the SYSTEM needs to be doing differently keeping VABB in mind. • What do we need to teach the staff short term • How do we build fluency of staff long term • How do we measure effect of efforts • How do we partner with families