Download
1 / 9
90 likes | 461 Views
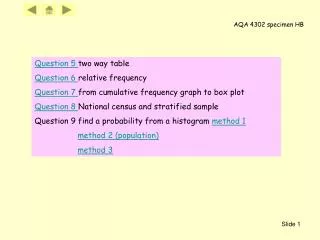
Question 5 two way table Question 6 relative frequency Question 7 from cumulative frequency graph to box plot Question 8 National census and stratified sample Question 9 find a probability from a histogram method 1 method 2 (population) method 3. 6 + 3 + 1 = 10 Probability =.

E N D
Question 5 two way table Question 6 relative frequency Question 7 from cumulative frequency graph to box plot Question 8 National census and stratified sample Question 9 find a probability from a histogram method 1 method 2 (population) method 3
6 + 3 + 1 = 10 Probability = 5. Karin is collecting data about the number of brothers and the number of sisters of the people in her class. Karin’s results are given in a two-way table • How many people have one brother? • (b) How many people have more brothers than sisters? • (c) There are 30 people in Karin’s class. • What is the probability that a randomly chosen person from her class has the same number of brothers and sisters? 7 + 3 + 2 + 1 = 13 7 + 2 + 1 + 1 = 11 6 marks: 2+2+2
or 0.3 = 6 times 6.Lynne has a spinner with coloured sections of equal size. She wants to know the probability that her spinner lands on blue. She spins it 100 times and calculates the relative frequency of blue after every 10 spins. Her results are shown on the graph. (a) Use the graph to calculate the number of times the spinner landed on blue in the first 20 spins 0.3 x 20 = 6 times 3 marks: 2 + 1 (b) Use the graph to estimate the probability that the spinner will land on blue. The most reliable estimate is the one for the highest number of spins so 0.2
7. The cumulative frequency diagram shows the lengths of 160 fish caught in a river one summer. The shortest fish was 7 cm. The longest fish was 42 cm. Use the graph and the information given to draw a box plot of the length of these fish. 160 … Median = 80th Lower quartile = 40th Upper quartile = 120th 27.5 23.5 30.5
3 marks 1 for the median 1 for the LQ and UQ 1 for the max, min and box
8. (a) What is a National Census? A questionnaire given to every home/person in the country 1 mark (b) According to a National Census, 23% of people are under 21 and 34% of people are over 60. Sally wants to give a questionnaire to a sample of 150 people stratified by age. Use the National Census figures to obtain a stratified sample of size 150. Under 21: 23% of 150 = 34.5 Over 60: 34% of 150 = 51 3 marks 1 for 51 1 for working out U21 and 21-60 1 for total = 150 Sample Under 21: 34 21 – 60: 65 Over 60: 51 or 35 64 51
55 to 75 = 3 squares So probability = 9. The histogram shows the age distribution of a town. There are 160 people under 20 years old in this town. Estimate the probability that a person chosen at random from this town is over 55 years old and under 75 years old. Method 1 Population = 24 squares 4 marks
400 Population = 960 Red = 80 + 40 = 120 So probability = 240 160 9. The histogram shows the age distribution of a town. There are 160 people under 20 years old in this town. Estimate the probability that a person chosen at random from this town is over 55 years old and under 75 years old. Method 2 160 people in 1 big square 160 4 marks
250 150 Population = 600 squares Red = 25 x 3 = 75 squares So probability = 100 9. The histogram shows the age distribution of a town. There are 160 people under 20 years old in this town. Estimate the probability that a person chosen at random from this town is over 55 years old and under 75 years old. Method 3 100 squares in 1 big square 100 4 marks