Assessment of Air Quality Monitoring Station Populations: A Network Analysis for EPA OAQPS
60 likes | 172 Views
This report evaluates the population distribution within air quality monitoring station sampling zones, prepared for the EPA OAQPS. It addresses key measures essential for risk assessment, compliance monitoring, and tracking pollutant concentration, particularly ozone (O3). By analyzing census data and assessing the population at each station, the report highlights significant disparities in population density across the Eastern US. Findings suggest that large populations correlate with higher health risks from air pollutants, while many stations may represent small impacted populations.

Assessment of Air Quality Monitoring Station Populations: A Network Analysis for EPA OAQPS
E N D
Presentation Transcript
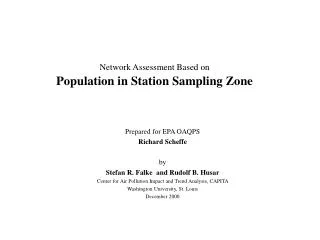
Network Assessment Based onPopulation in Station Sampling Zone Prepared for EPA OAQPS Richard Scheffe by Stefan R. Falke and Rudolf B. Husar Center for Air Pollution Impact and Trend Analysis, CAPITA Washington University, St. Louis December 2000
AQ Management Activity Geographic Info. Need Station Measure Risk assessment Pollutant concentration 4th highest O3 Risk Assessment Persons/Station Compliance evaluation Conc. vicinity to NAAQS Deviation from NAAQS Reg./local source attribution & tracking Spatial coverage Area of Sampling Zone All above Estimation uncertainty Meas. & estimate difference Network Assessment Based on Population in Station Sampling Zone • There are at least five different measures that represent the information need for (1) risk assessment, (2) compliance monitoring and (3) tracking are listed below. • The number of persons in a station’s sampling zone measures the population at risk. • Using this objective measure, the station with the largest population is ranked #1. Persons in sampling zone
Population Density • The population data are available on census track resolution. • The population density is highly textured; it varies by three orders of magnitude over the EUS.
Population in Each Station Sampling Zone • The population for each monitor was calculated from census tract population data (1990) from available from ESRI. • The station population was calculated by summing the persons in each census tracts located within the sampling zone polygon of the station. • Following the spatial join operation, the population was added as an attribute of each station.
Population Distribution Function • Over the Eastern US, the average number of persons in an O3 station sampling zone is 220,000. • The distribution of population/station varies from virtually zero (hard to measure) to 2.8 million. • The 25% of the stations with the smallest population accounts for 4% of the total EUS population while the upper station quartile includes 60% of the total population. • In other words, eliminating 25% stations with the lowest population would be affecting only 4% of the EUS population. • The population in each sampling zone is weakly correlated with the sampling zone area since the population density varies greatly.
Ranking by Population in the Sampling Zone • The number of persons in a station’s sampling zone is a scaling factor for the overall health risk. • Areas of large population per station (red) are found over the NE megalopolis but also over more remote areas. • Small population/station (blue) is generally found remote sites but also in some urban clusters, e.g. Chicago, New Orleans, St. Louis. • From the perspective of population coverage, the blue stations have the lowest rank.