Download
1 / 19
190 likes | 393 Views
IS Metrics for C2 Processes. Working Group 3 Brief Team Leaders: Steve Soules Dr. Mark Mandeles. Charge to the C2 Processes Working Group. Objective: Develop metrics to measure the quality of command and control processes

E N D
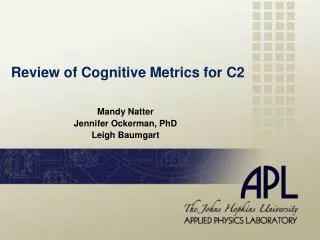
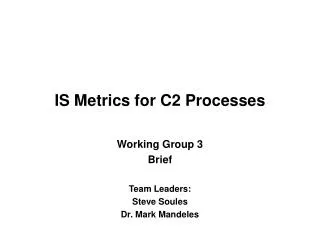
IS Metrics for C2 Processes Working Group 3 Brief Team Leaders: Steve Soules Dr. Mark Mandeles
Charge to the C2 Processes Working Group • Objective: Develop metrics to measure the quality of command and control processes • Examine historic examples of the impact information technology has had on command and control processes. • Identify common factors that can be used to measure the quality of the command and control processes, including speed of command, correctness of decisions, and effects of dissemination of commands. • Review the results of the other three Groups. Apply their findings to the command and control factors to begin to define command and control process changes that could better take advantage of information superiority improvements. • Define the metrics that can be used to capture the quality of the command and control processes. • Discuss ideas for potential futures areas of analysis.
Command & Control Process Definition • Working Group C2 Process Definition: The integration of organizations, systems and doctrine used by commanders to direct forces to accomplish missions • Examples of C2 Processes: • Command and Control by Direction • Command and Control by Negation • Centralized Command / Decentralized Execution • Autonomous Control (e.g., special operations or submarine operations) • Command and Control by Self Synchronization (for future: combat group makes its objectives)
C2 Process Metrics Users • Acquisition Analysts • Experiment/Exercise Analysts • Operations Analysts • M&S Developers • Seeking Metrics to evaluate if C2 Processes are: • - Operationally Sound • - Technically Feasible • - Cost Effective
Threats/Missions Risks Adaptive Visualization Speed of Command Speed of Force Actions Awareness Shared Awareness Synchronization Confidence Scale Environment Dissemination of Commands Reach Richness Efficiency Correctness Completeness Collaboration Interaction Human Factors Experience Fatigue Stress Initiative Errors and Types of Errors C2 Factors to Consider inDetermining Metrics
Three Areas of C2 Process Evaluation • Performance of the C2 Process: • Ability of the process to Monitor / Understand / Develop / Predict • Ability of the process to Decide / Direct / Collaborate • Effectiveness of the C2 Process: • Ability to improve Force Synchronization • Ability to improve shared awareness • Ability to collaborate and interact in each of the process functions • Impact of the C2 Process on Force / Mission Effectiveness: • Satisfy mission objectives in an efficient manner
HEADQUARTERS PREDICT CONSEQUENCES DEVELOP ALTERNATIVE ACTIONS UNDERSTAND DECIDE MONITOR DIRECT C2 Process Functional Areas Source: (Evidence Based Research)HEAT Analytic Structure ENVIRONMENT: - OWN & ENEMY FORCES - PHYSICAL - POLITICAL & ECONOMIC QUERY INFORM
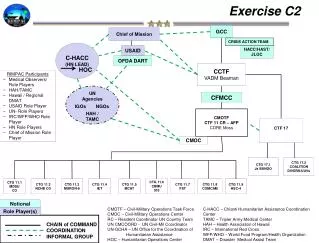
W CJTF e JOINT BATTLE MANAGEMENT JFACC JFLCC a JFMCC USAF USMC p USN USA o Autonomous Control n s How do you measure the performance, effectiveness and impact of C2 Processes? Monitor Command by Direction Network Command by Negation Understand “Power of Collaborative Interaction” Execution C2 Decide Direct Develop Alternatives Predict Consequences Synchronized Command and Control
Measuring the Effectiveness of the C2 Process • Ability to Synchronize Forces • Ability to gain knowledge rapidly to enhance awareness, build confidence and execute sound judgement • Ability to collaborate and interact • Ability to mitigate errors, e.g., incorrect target identification • C2 Errors • Friendly fire • Inadequate analysis, e.g., Chinese Embassy in Belgrade • Inappropriate information • System breakdowns or crashes
Measuring the Impact of the C2 Process on Mission / Force Effectiveness: • Complete mission objectives • Yes/No • Efficiently Complete mission objectives • Fewer Casualties • Faster Time • Fewer Leakers • Less Collateral Damage
Examples of Metrics for MOP’s in the C2 Functional Areas **Note:“accuracy” also implies its opposite -- “error” ie. transmission error rate/“ground truth”
Example of Graphing MOP Aggregate Performance (Hrs) Time Richness (% of Ground Truth) C2 Poc #2 C2 Poc #1 **Note: This graph could be integrated with the the synchronization and awareness graphs to show integrated effects. Reach (# Of Forces Connected)
C2 Process EvaluationMOP and MOE Conversion/Graph • Conversion factor: Score/Grade by range of performance: Value State Space • MOPs Relationship to MOEs: Influence Diagram/ Cause and effect analysis / Multi attribute utility analysis • Error Analysis: Tradeoff Between Type I and Type II Error • Graph: Richness, Reach, Time, Number of Objectives, Time to Objectives, Loss Exchange Ratio values from Score/Grade • Simulation as a Sensitivity Test
(Hrs) (Hrs) Time Time Reach Richness (# of Forces Connected) (% of Ground Truth) CP #1 CP #2 Agg MOE Value Agg MOP Value Time (Value State Space) (Value State Space) Reach Richness (Ratio) Loss Exchange Missions Met (#s) MOP Value MOE Value Loss Exchange Missions Met Time Example of GraphingMOP and MOE Aggregate Evaluation Time Reach Richness MOP Value MOE Value Loss Exchange Missions Met Time
Summary • Measuring C2 processes requires an evaluation of both the performance and the effectiveness of the process in meeting military objectives • The individual performance of interaction and collaboration enabled by future networks is difficult to measure but we should be able to capture its effects in conducting C2 functions • The MOPs and MOEs introduced should be further evaluated before being used in a limited objective experiment in a controlled situation as a starting point • What discussion/research needs to be accomplished next?