Download
1 / 23
270 likes | 521 Views
Steps towards Ecosystem Based Fisheries Management in New Zealand . Rosemary Hurst National Institute of Water and Atmospheric Research Ltd. Pamela Mace Ministry of Fisheries Wellington, N.Z. Outline. Introduction to NZ The developing legislative and policy framework

E N D
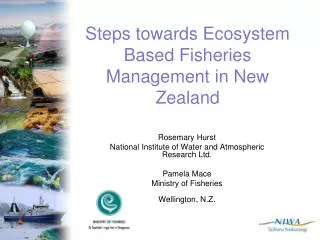
Steps towards Ecosystem Based Fisheries Management in New Zealand Rosemary Hurst National Institute of Water and Atmospheric Research Ltd. Pamela Mace Ministry of Fisheries Wellington, N.Z.
Outline Introduction to NZ The developing legislative and policy framework The role of single species management Examples of progress with specific ecosystem management measures or initiatives
NZ Management Region Large 200 nm EEZ 4 mill. km2 = 5th largest > 16,000 marine species identified many unique to NZ 130 species commercially fished Many migratory species, including marine mammals and seabirds that depend on NZ breeding areas and feeding grounds
Oceanography and Bathymetry Productivity influenced by location in the Pacific, bathymetry, ocean currents, and climate Subtropical to Sub Antarctic waters Large variety of marine habitats including plateaus, canyons, ~800 seamounts, and a trench down to 10,000m = 2nd deepest place About 35% of the EEZ is in trawlable depths (0–1500 m)
Single species management 1978: 200 nm EEZ declared 1983: Deepwater policy – IQ on 7key species 1986: the Quota Management System (QMS) – ITQs on 26 species Now 96 species across 628 fishstocks total TACC = 573,000t; actual catch = 441,000t information to determine stock status on 20% stocks (50% catch) Harvest Strategy Standard 2008
Desired Fisheries Outcome Environmental Standards Information Input and Consultation: Links with other Environmental Instruments Monitor effectiveness of the Strategy Monitor and enforce performance Information from Implementation Achieve Environmental Standards through fisheries management frameworks, including through Fisheries Plans Actual Fisheries Outcomes Framework for managing the effects of fishing on the aquatic environment
Seabird Standard Pre-Standard : National Plan of Action (2004), largely voluntary measures Standard Framework: Risk management targets Ensure depleted populations re-build Potentially include incidental mortality objectives at the fishery level Link to current management measures – mitigation devices
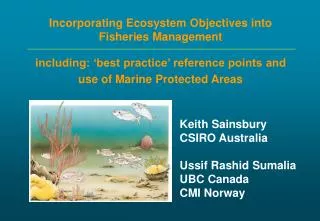
Marine Protected Areas (MPA) To protect marine biodiversity with a comprehensive and representative network of New Zealand’s marine habitats and ecosystems – and to protect habitats and ecosystems that are outstanding or rare Protection standard – 2 levels: “no-take” and limited extraction/damage Multi-agency approach Distinct from other closures with differing objectives Significant links to other ecosystem initiatives
MPA • Current focus territorial sea (12nm) • Based on 14 Coastal Biogeographic regions • First MPA plans begun west coast South Island and Sub Antarctic Islands – slow progress • Need to link with other spatial management measures, e.g. Marine Reserves (33) • May lessen quota value or cause displacement of effort problems
Marine Stewardship Council Certification • Increased industry awareness of the need to engage and focus efforts on meeting international standards • Areas where industry has done or is doing things that are above what government requires: • recent fur seal census • developing more active engagement with environmental groups • developing reference points and rebuilding strategy • developing a 10 year research plan • first Environmental Risk Assessment for any NZ fishery • MSC impact on the significant reduction in seabird catch and support for research initiatives on benthic effects and trophic studies is unclear
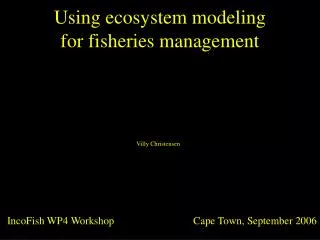
NZ sea lions -bycatch limitation(Phocarctus hookeri) • endemic species, limited breeding sites on Sub Antarctic Islands • population “threatened”, current size ~10,000 • incidental drownings in squid trawl fishery around Auckland Is. • voluntary industry sealion excluder devices (SLEDs) – survival rate difficult to determine Photo: Louise Chilvers (DoC)
NZ Sea lion bycatch limit • Annual fishing-related mortality limit (FRML) comes from an operational management procedure • current FRML = 2 * 0.02577 * observed pups in previous two years • control rule is based on detailed population model and extensive simulations • Goal is to maintain the population at 90% of the zero-fishing level, 90% of the time • FRML is translated to allowable tows, using assumed catchability of trawls and mortality rates in SLEDs and trawls • current season limit is 95
Dolphin exclusion areas(Cephalorhynchus hectori) Hector’s and Maui’s dolphins (“vulnerable” and “critical”) Small inshore coastal species with a limited home range Estimated about 7600 Setnets main threat Area restrictions on setnet and trawl 2009 first time observers used extensively on small inshore vessels to monitor interactions
Seamount Closures (2000) ~1200 seamounts, knolls and hills (UTFs) 19 represeantative seamounts were closed to bottom trawling and dredging 18 unfished 1 fished “Morgue” recovery being monitored
Graveyard - “recovery” small Stylasterids (hydrocorals) : 2001 cf. 2006
Benthic Protected Areas (2007) Industry initiative Protect 30% of the EEZ seabed from the use of bottom trawling and dredging activity Represent about 90% of all the areas currently under some form protection from fishing No implementation of MPAs in EEZ (12–200nm) to 2013; not yet clear if BPAs will fit MPA definition
Benthic Protected Areas (BPA) 20 class Marine Environment Classification 2005, based mainly on physical variables but incl. research trawls BPA based on 9 oceanic classes, protects ≥10% of each class Current research incl. invertebrates in the MEC and fine scale analysis of bottom trawl footprints
BPA and seamounts 28% of Underwater Topographical Features 52% of seamounts (underwater mountains > 1000 m in height) 88% of active hydrothermal vents Off-bottom trawl fishing is permitted to within 100 metres with strict controls
Conclusions – EBFM Progress • Ability to limit and control capacity and fishing mortality key first step towards EBFM • QMS and ITQs effective at reducing capacity and maximising efficiency • Significant development of frameworks and approaches that will contribute to ecosystem management • Biodiversity and SMEEF strategies • Variety of protected areas and protected species management initiatives; Standards under development • MSC Certification • Key challenges • Co-ordinated frameworks that effectively links strategies and measures • Plugging important information gaps: catching sectors and effects of fishing and biodiversity research
Acknowledgements • NIWA: Malcolm Clark, Paul Breen, Suze Baird, Andy McKenzie • Ministry of Fisheries:, Steve Halley, Aoife Martin, Jeremy Halsen, Martin Cryer • SeaFIC : Kevin Stokes, David Middleton