Satellite Retrievals
390 likes | 557 Views
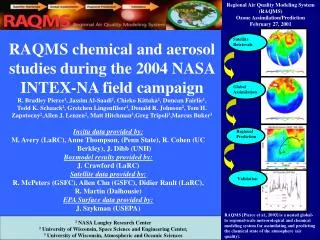
Regional Air Quality Modeling System (RAQMS) Ozone Assimilation/Prediction February 27, 2001. Satellite Retrievals. Global Assimilation. Regional Prediction. Validation. RAQMS chemical and aerosol studies during the 2004 NASA INTEX-NA field campaign

Satellite Retrievals
E N D
Presentation Transcript
Regional Air Quality Modeling System (RAQMS) Ozone Assimilation/Prediction February 27, 2001 Satellite Retrievals Global Assimilation Regional Prediction Validation RAQMS chemical and aerosol studies during the 2004 NASA INTEX-NA field campaign R. Bradley Pierce1, Jassim Al-Saadi1, Chieko Kittaka1, Duncan Fairlie1, Todd K. Schaack2, Gretchen Lingenfilser1, Donald R. Johnson2, Tom H. Zapotocny2,Allen J. Lenzen2, Matt Hitchman3,Greg Tripoli3,Marcus Buker3 Insitu data provided by: M. Avery (LaRC), Anne Thompson, (Penn State), R. Cohen (UC Berkley), J. Dibb (UNH) Boxmodel results provided by: J. Crawford (LaRC) Satellite data provided by: R. McPeters (GSFC), Allen Chu (GSFC), Didier Rault (LaRC), R. Martin (Dalhousie) EPA Surface data provided by: J. Szykman (USEPA) RAQMS [Pierce et al., 2003] is a nested global- to regional-scale meteorological and chemical modeling system for assimilating and predicting the chemical state of the atmosphere (air quality). 1 NASA Langley Research Center 2 University of Wisconsin, Space Science and Engineering Center, 3 University of Wisconsin, Atmospheric and Oceanic Sciences
RAQMSG Chemical Assimilation Chem/Met Forecast Cycle EPTOMS O3 Column 24hr chemical assimilation 72hr Chem/Met Forecast 12Z 18Z 00Z 06Z GFS Analyses 12Z 18Z 00Z 06Z 12Z 18Z 00Z 06Z GFS Analyses GFS Analyses Real-Time 2x2.5 Degree resolution Kawa Table photolysis Climatological wet deposition May 11- Aug 31, 2004 Post-mission 1.2x1.4 Degree resolution Fast-J2 photolysis GMI (Harvard) wet deposition EPTOMS O3 Column, HALOE, SAGE II, SAGE III Solar Occultation Continous chemical assimilation Continous chemical assimilation June 30-July 31, 2004 Global component of the LaRC/UW-Madison Regional Air Quality Modeling System (RAQMS) uses the UW-Hybrid dynamical core, LaRC unified strat/trop chemistry, and Statistical Digital Filtering (SFD) for real-time TOMS Ozone assimilation and chemical/dynamical predictions and post mission TOMS+Solar Occultation assimilation.
Verification of RAQMS Upper Air O3 Analysis: INTEX RAQMS/DC8 Insitu O3 (M. Avery, LaRC) July 2004 RAQMS TOC and DC8 Flight Tracks RAQMS O3 analysis shows very good agreement with in-situ O3 except for overestimates associated with tropopause encounters
Verification of RAQMS Upper Air NO2 Analysis: INTEX RAQMS/DC8 Insitu NO2 (R. Cohen, UC-Berkley) July 2004 RAQMS NO2 and DC8 Flight Tracks RAQMS NO2 underestimates upper tropospheric NO2 (lightning NOx ?), and overestimates PBL median mixing ratios. RAQMS NO2 column is within 5% of the observed median column.
Verification of RAQMS Upper Air PAN Analysis: INTEX RAQMS/DC8 Insitu TPAN (R. Cohen, UC Berkley) July 2004 RAQMS PAN and DC8 Flight Tracks RAQMS PAN captures the observed profile shape (which indicates strong convective influences) of the observed PAN, but tends to underestimate the mixing ratio above the PBL.
Verification of RAQMS Upper Air O3 P-L Analysis: INTEX RAQMS/DC8 Boxmodel P-L (Crawford, LaRC) July 2004 RAQMS O3 P-L and DC8 Flight Tracks RAQMS O3 P-L analysis shows good agreement with constrained Box model calculations in the middle troposphere. RAQMS P-L underestimates upper tropospheric (lightning NOx ?), and overestimates PBL P-L.
Verification of RAQMS Upper Air HNO3 Analysis: INTEX RAQMS/DC8 Insitu HNO3 (J. Dibb, UNH) July 2004 RAQMS HNO3 and DC8 Flight Tracks RAQMS HNO3 underestimates observed HNO3 below 400mb with GMI implementation of Harvard wet deposition.
RAQMS Lagrangian Analyses: (D. Fairlie Lead) • Method: • Initialize uniform 3D grid of trajectories • Compute backward trajectories • Sample and average RAQMS chem/dyn fields along back trajectories. • Map Lagrangian average back onto original uniform grid. • Result: • Synoptically mapped photochemical, mixing, and transport processes • following air parcels via Reverse Domain Filling (RDF) 5-day 340K Lagrangian Averaged PV 18Z 20040718
RAQMSG 456mb Lagrangian Analyses 18Z July 18th, 2004 Enhanced ozone production in NE outflow and within trough axis over mid-west. Enhanced ozone loss within Southerly flow from Gulf of Mexico
RAQMSG 456mb Lagrangian Analyses 18Z July 18th, 2004 Enhanced loss of NOy due to wet deposition within synoptic and frontal precipitation bands.
RAQMSG 456mb Lagrangian Analyses 18Z July 18th, 2004 Ascent of maritime airmass from Gulf of Mexico. Descending airmass coming in behind synoptic low pressure system.
RAQMSG 340K Lagrangian Analyses 18Z July 18th, 2004 Asian transport to south of stratospheric airmass associated with large Rossby wave breaking event. Stratospherically influenced air on edge of Bermuda high.
RAQMSG 340K Lagrangian Analyses 18Z July 18th, 2004 Enhanced PAN/NOy ratios over Western US, Bermuda High, and associated with long-range transport from Asia.
RAQMSG 340K Lagrangian Analyses 18Z July 18th, 2004 Asian transport within strong mixing zone. Bermuda high shows inner core with very weak mixing (stirring) and outer edge with strong mixing.
Rossby Wave Folding events Rossby Wave breaking is an upstream source for stratospheric ozone in the upper troposphere. Asian outflow is likely to be highly influenced by STE associated with Rossby wave breaking in Western Pacific during June-August.
Indirect Validation of SAGE III Limb Scattering Measurements: (D. Rault, Lead) • Through coordination with the SAGE III science team (D. Rault, C. Trepte, NASA/LaRC) , special limb scattering measurements where conducted during May, July and August, 2004 over the Eastern US and North Atlantic in support of the 2004 INTEX-NA mission. • We have begun indirect validation studies where RAQMS ozone analyses are used as a transfer standard between the INTEX-NA IONS ozonesonde data and contemporaneous, but not coincident, SAGE III LS measurements.
RAQMS and NOAA GFS vs IONS ozonesonde: July 2004 RAQMS O3 Mean bias* and RMS errors <20% above 100mb. *Reduction in the high biases relative to GFS due to assimilation of high vertical resolution solar occultation measurements instead of SBUV2. Reduction in tropospheric low biases relative to GFS due to the inclusion of realistic tropospheric ozone photochemistry.
RAQMS vs SAGE III Limb Scattering (Rault): July 2004 RAQMS Total Column Ozone July 2004. RAQMS vs SAGE III LS O3 Mean Bias and RMS Errors are </= Sonde statistics. RMS Error is consistent with estimated SAGE III LS retrieval uncertainty.
Indirect validation of SCIAMACHY (Martin) tropospheric NO2 column RAQMS Median Column compares very well with insitu estimates within domain sampled by DC8 (Eastern US). RAQMS Mean column is generally low relative to SCIAMACHY. Particularly in urban centers and generally over the western US.
RAQMS Regional Aerosol Assimilation and Forecasting Case Study: (C. Kittaka, Lead) July 18-July 22, 2004 PM2.5 AQI event
EPA AIRNow PM25 AQI: July 18- July 22, 2004 Moderate PM2.5 AQI on July 20, Unhealthy for sensitive groups in Great Lakes on 21st then SE-NE by July 22, 2004.
MODIS Aerosol Optical Depth (A. Chu): July 18- July 22, 2004 7/20 7/19 7/18 7/21 Smoke from Alaskan Forest Fires 7/22 Link between Alaskan smoke and US AQ?
RAQMS regional Aerosol Forecast MODIS AOD assimilation GasPhase H2O2, O3, SO2, NH3, HNO3, OH, DMS, MSA Aerosol Phase SO3, SO4, NH4, NO3, BC, OC, Dust, SeaSalt Chemical Constituents in RAQMS Regional (Aerosol) Thermodynamic Equilibrium (MARES) Gas Phase Reactions Scavenging/Activation (not implemented) Dry deposition Dry Deposition In Clouds (Liquid and Ice) H2O2, SO3, SO4, NH4, NO3 Dry/Wet Depositions • Initialized on July 15, 2004 • UWNMS Dynamical Core • 80Km Continental US/EDAS Met BC/IC • RAQMSG Chemical BC/IC • GOCART background climatological IC/BC • Sulfate [Kittaka, 2004], Dust, Sea Salt, Carbonaneous Aerosol from GOCART [provided by Mian Chin, GSFC] • Nitrate and Ammonium from GOES-CHEM [provided by Rokjin Park, Harvard] • BC+OC perturbations added above BL on 18Z July 18, 2004, vertical extent constrained by SSEC Lidar • One MODIS AOD assimilation cycle used for final constraint on total AOD Does Smoke from Alaskan Fires get entrained within CONUS boundary Layer?
MODIS vs RAQMS AOD 17:28Z July 18, 2004 Assimilated Smoke plume 07/18 Smoke Plume aloft
MODIS vs RAQMS AOD 16:33Z July 19, 2004 New Smoke plume (not assimilated) Sulfate plume previously obscured by clouds (not assimilated) RAQMS/MODIS AOD show good agreement elsewhere 07/19 Smoke Plume aloft
MODIS vs RAQMS AOD 17:16Z July 20, 2004 New Smoke plume transported Southeastward RAQMS underestimates Gulf Coast AOD 07/20 Smoke Plume aloft
MODIS vs RAQMS AOD 16:20Z July 21, 2004 New Smoke and Sulfate plume move Northeastward RAQMS significantly underestimates PA AOD, but agrees will with EPA PM2.5 at surface New Smoke aloft 07/21 Assimilated Smoke Plume entrained
MODIS vs RAQMS AOD 15:27Z July 22, 2004 New Smoke and Sulfate plume merge AOD over Eastern Seaboard is significantly underestimated, PM2.5 is Underpredicted by ~30% 07/22 Assimilated Plume entrained
EPA Surface Speciation Data July 2004 July 20, 2004 July 20, 2004 PM2.5 AQI over the SE US (Region 04) was influenced by both local sulfate and Alaskan carbonaceous aerosols during July 22 AQI event.
Continuing Research/Manuscript Plans: • Alaskan Fires: • Regridded (based on daily MODIS fire counts) climatological Alaskan/Canadian emission runs currently being conducted with RAQMSG (problems with plume transport within polar filter ). • Development of NRT fire emissions based on MODIS fire counts, climatological carbon load and Heines index based fire intensity estimates (with Amber Soja, NRC/LaRC). • Assimilation: • RAQMSG SAGE III Limb Scattering impact studies in preparation for INTEX-B OMI+SAGE III Limb Scattering Assimilation • RAQMSN MODIS AOD Assimilation in preparation for CALIPSO launch. • Regional budgets • Conduct Continental US NOy and O3 budget studies (similar to RAQMS SE Asian O3 budget during TRACEP) • Conduct RAQMSN two-scale STE analyses within Pacific Rossby wave breaking events. • Lagrangian Analysis • Statistical analysis of Lagrangian maps to determine dominate source/receptor relationships and magnitudes of chemical transformation during long-range transport.
RAQMS unified (strat/trop) chemistry 1) Ox 2) Noy 3) Cly 4) Bry 5) HNO3 6) N2O5 7) H2O2 8) HCl 9) ClONO2 10) OClO 11) N2O 12) CFCl3 (F11) 13) CF2Cl2 (F12) 14) CCl4 15) CH3Cl 16) CH3CCl3 (MTCFM) 17) CH3Br 18) CF3Br (H1301) 19) CF2ClBr (H1211) 20) HF 21) CFClO 22) CF2O 23) CH4 24) HNO4 25) HOCl 26) H2O 27) NO3 28) NO2 29) CH2O 30) CH3OOH 31) CO 32) HBr 33) BrONO2 34) HOBr 35) BrCl 36) Cl2 (55 species/families explicitly transported, 86 calculated, PCE assumptions for “fast” species) 37) C2H6 (ethane, 2C) 38) ALD2 (acetaldehyde+higher group, 2C) 39) ETHOOH (ethyl hydrogen peroxide, 2C) 40) PAN (2C) 41) PAR (paraffin carbon bond group, 1C) 42) ONIT (organic nitrate group, 1C) 43) AONE (acetone, 3C) 44) ROOH (C3+hydrogen peroxides group, 1C) 45) MGLY (methylglyoxal, 3C) 46) ETH (ethene, 2C) 47) XOLET (terminal olefin carbon group, 2C) 48) XOLEI (internal olefin carbon group, 2C) 49) XISOP (isoprene, 5C) 50) XISOPRD (isoprene oxidation product-long lived, 5C) 51) PROP_PAR (propane paraffin, 1C) 52) CH3OH (methanol) 53) XMVK (methyl vinyl ketone, 4C) 54) XMACR (methacrolein, 4C) 55) XMPAN (peroxymethacryloyl nitrate, 4C) Stratosphere+CH4&CO oxidation NMHC Chemistry Chemical families Ox=O(1D)+O(3P)+O3+NO2+HNO3+2(NO3)+3(N2O5)+HNO4+PAN+MPAN NOy=N+NO+NO2+NO3+2(N2O5)+HNO3+HNO4+BrNO3+ClNO3+PAN+ONIT+MPAN Cly=HCl+ClONO2+ClO+2(Cl2O2)+OClO+ClO2+2(Cl2)+BrCl+HOCl+Cl Bry=HBr+BrONO2+BrO+BrCl+HOBr+Br
July, Med O3, High NOx RAQMS NMHC Treatment • Explicit treatment of C2H6 (ethane), C2H4 (ethene) and CH3OH (methanol) oxidation [Sander et al., 2003]. C3H8 (propane) is handled semi-explicitly. • C4 and larger alkanes and C3 and larger alkenes are lumped via a carbon-bond approach [Zaveri and Peters, 1999]which accounts for long-lived species and their intermediates based on the Carbon Bond Mechanism IV [Gery et al., 1989]. • Isoprene is modeled after the Carter 4-product mechanism as modified for RADM2. 10-day diurnal equilibrium runs with/without NMHC conducted as part of the NASA Global Modeling Initiative (GMI) unified chemistry development. GMI Harvard mechanism [Bey et al., 2001] with Gear solver for 80 species (all transported in GMI) LaRC Run Versions • Standard • Revised 1: Remove NO3 + peroxy radical rxns • Revised 2: Revised 1 + ... • Peroxide oxidation branching matched to GMI • Organic nitrate production matched to GMI • RO2 + NO branching matched to GMI
Gas Phase H2O2, O3, SO2, NH3, HNO3, OH, DMS, MSA Aerosol Phase SO3, SO4, NH4, NO3, BC, OC, Dust, SeaSalt Chemical Constituents in RAQMS Regional (Aerosol) Thermodynamic Equilibrium (MARES) Gas Phase Reactions Scavenging/Activation (not implemented) Dry deposition Dry Deposition In Clouds (Liquid and Ice) Sulfate [Kittaka, 2004] Dust, Sea Salt, Carbonaneous Aerosol from GOCART [provided by Mian Chin, GSFC] Nitrate and Ammonium from GOES-CHEM [provided by Rokjin Park, Harvard] Chemical constraints from 6hr RAQMS global analyses [Pierce, 2003] H2O2, SO3, SO4, NH4, NO3 Dry/Wet Depositions
EPA Speciated PM2.5 Network 07/20/04
Impact of Improved Wet Deposition on RAQMS Upper Air HNO3: INTEX RAQMS/DC8 Insitu HNO3 (J. Dibb, UNH) With GMI (Harvard) Wet Deposition With Climatological Wet Deposition Plan to take advantage of on-line implementation of RAQMS chemistry (instantaneous 3D precipitation, clouds, convective updraft velocities) to improve treatment of wet deposition formulation.
RAQMSG 340K Lagrangian Analyses 18Z July 18th, 2004 Enhanced ozone production over Western US, spiraling into Bermuda High, and associated with long-range transport from Asia. Enhanced PAN/NOy ratios over Western US, Bermuda High, and associated with long-range transport from Asia. Asian transport to south of stratospheric airmass associated with large Rossby wave breaking event. Stratospherically influenced air on edge of Bermuda high. Asian transport within strong mixing zone. Bermuda high shows inner core with very weak mixing (stirring) and outer edge with strong mixing.
RAQMS vs HALOE NO2 retrieval: July 2004 RAQMS NO2 Mean Bias* and RMS Errors < 40% above 100mb. *RAQMS stratospheric NO2 underestimates in middle and lower stratosphere are consistent with systematic NOx/NOy underestimates found during 1997 POLARIS mission [Pierce et al., 1999] Randell et al. [2001] found HALOE upper stratospheric NO2 low by ~1 ppbv and HALOE middle stratosphierc NO2 high by ~10% relative to POAM. Randell [2001]
RAQMS Total Column Ozone July 2004. RAQMS 18Z Total Column NO2 July 2004. RAQMS vs SAGE III LS NO2 Mean Bias and RMS Errors are </= Sonde statistics. RMS Error is consistent with estimated SAGE III LS retrieval uncertainty.