MOZART-2
Max-Planck Institut für Meteorologie Max Planck Institute for Meteorology. What?. Where?. When?. Area Burnt IFFN reports, global satellite products: GBA 2000, GLOBSCAR location of emissions. Fire counts global satellite products: WFW,ATSR, MODIS timing. Vegetation

MOZART-2
E N D
Presentation Transcript
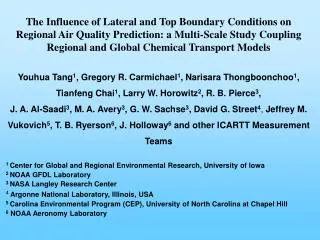
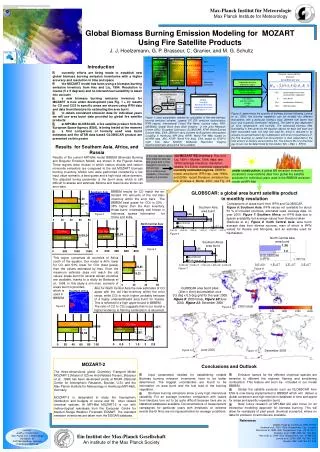
Max-Planck Institut für Meteorologie Max Planck Institute for Meteorology What? Where? When? Area Burnt IFFN reports, global satellite products: GBA 2000, GLOBSCAR location of emissions Fire counts global satellite products: WFW,ATSR, MODIS timing Vegetation map/-model JSBACH vegetation type C pools data 500 1000 1500 2000 0 data source delivered informaton How much burns? amount of biomass burnt Final product global monthly Biomass Burning emission inventory resolution: 1° x 1° EF(CO) EF(CO2) amount of emitted species Xi CO, CO2 ER(Xi) Figure 2: determining the quantity of biomass burned following Lavoue et al., 2000: the burning vegetation can be divided into different ecosystems with a particular biomass load, different fuel layers that burn, and a specific combustion efficiency. The latter is also dependent on wind, temperature, and humidity. The consumed biomass MBB [t/gridcell/a] is then given by the equation above: for each fuel layer and each ecosystem type, the total fuel load Bk,i [t/ha] is reduced to its actually consumed fraction by multiplication with its burning efficiency [%].The resulting so called fuel consumption is then expanded to the total amount of hectars consumed by fire. The amount MXi of a chemical gas Xi can now be determined by the relation: MXi = MBBx ER(Xi) (i) the raw data is taken from different sources and years and is then merged to provide a climatology, (ii) no interannual variability of biomass burning is provided old MOZART BB inventory: Hao and Liu, 1994 + Mueller, 1994, data: late 1970s average inventory, resolution: coarse, 5 x 5 deg, unprecise seasonality currently estimated regions: BBBEM model, area burnt: IFFN rep., late 1990s and 2000+ recent literature, emission fac-tors: Andreae a. Merlet, 2001, see Fig. 4-6 Southern Asia area burnt x 10E7 ha Figure 6 North Central Asia area burnt Southern Africa area burnt Southern Africa location of carbon C in the vegetation x 10E7 ha Barbosa et al. x 10E7 ha Figure 7 Figure 8 CO Hao CO BBBEM North Central Asia Tg CO2 Hao CO2 BBBEM 3 10 Tg Ein Institut der Max-Planck Gesellschaft An institute of the Max Planck Society Global Biomass Burning Emission Modeling for MOZART Using Fire Satellite Products GLOBSCARarea burnt pixel (1km x 1km) accumulation on a 0.5 deg x 0.5 deg grid for the year 2000Figure 9: 2000 totals, Figure 10:June 2000, Figure 11: December 2000 J. J. Hoelzemann, G. P. Brasseur, C. Granier, and M. G. Schultz Introduction • currently efforts are being made to establish new global biomass burning emission inventories with a higher accuracy and resolution in time and space • the MOZART model has been using a biomass burning emission inventory from Hao and Liu, 1994. Resolution is coarse (5 x 5 degrees) and no interannnual variability is taken into account • a new biomass burning emission inventory for MOZART is now under development (see Fig. 1 + 2): results for CO and CO2 in specific areas are shown using IFFN data and data from literature for estimating the area burnt • to obtain consistent emission data for individual years we will use area burnt data provided by global fire satellite products • at MPI-Met GLOBSCAR, a fire satellite product from the European Space Agency (ESA), is being tested at the moment • a first comparison of formerly used area burnt estimates and the ATSR data based GLOBSCAR product are presented on this poster biomass consumed MBB : biomass per grid box per year vegetation diversity M different types %Sk : percentage of box area covered with vegetation A : area burnt βk,i : combustion efficiency Bk,i : biomass load fuel layers: ground, surface, canopy n=3 Figure 1: input parameters needed for calculation of the new biomass burning emission scheme. Legend: EF, ER: emission factors/ratios; IFFN reports: International Forest Fire News, country notes, FAO; GBA2000: Global Burnt Area 2000 Initiative of the Joint Research Centre (JRC), European Comission; GLOBSCAR: ATSR World Burned Surface Atlas, ESA; JSBACH: Jena Scheme for Biospheric Atmosphere Coupling in Hamburg, MPI-Jena; WFW: World Fire Web, based on AVHRR data, JRC; ATSR: World Fire Atlas, ESA, based on ATSR-2 night time data; MODIS: Moderate Resolution Imaging Spectroradiometer aboard the Terra satellite Results for Southern Asia, Africa, and Russia Results of the current MPI-Met model BBBEM (Biomass Burning and Biogenic Emission Model) are shown in the Figures below. Three regions were chosen in which carbon dioxide and carbon monoxide emissions are compared to the old MOZART biomass burning inventory. Model runs were performed considering a low input value scenario, a best guess and a high input value scenario. The adjusted tuning parameter is the burnt area, which is still difficult to assess and estimate. Minima and maxima are shown as error bars. under construction: a global BB emission inventory: consistent, near-realtime data from global fire satellite products for individual years used in the BBBEM emission model at MPI-Met BBBEM results for CO match the es-timated CO amounts of the old Hao-inventory within the error bars. The BBBEM best guess for CO2 is 20% - 38% higher than the Hao inventory. Areas burnt: moderately well known in Indonesia, sparse information for China and India. GLOBSCAR: a global area burnt satellite product in monthly resolution Southern Asia CO Hao Comparisons of areas burnt from IFFN and GLOBSCAR Figure 6: Southern Asia: IFFN values not available for about 50 % of included countries, estimates used, average data, no year 2000. Figure 7: Southern Africa: no IFFN data due to sparse availability but average values from literature taken (Barbosa et al.) Figure 8: North Central Asia: area burnt average data from diverse sources, main of which is IFFN values for Russia and Mongolia, and an estimate used for Kazhakstan CO BBBEM Tg Figure 3 CO BBBEM CO2 Hao CO2 Hao CO2 BBBEM CO2 BBBEM Tg Tg Figure 4 1,0 This region comprises all countries of Africa south of the equator. Our model is 40% lower for CO and 53% lower for CO2 (best guess) than the values estimated by Hao. Even the maximum estimate does not reach the old values. Areas burnt for several african countries are available, thanks to a study by Barbosa et al., 1998. In this study a min./max. scenario of areas burnt is provided, which is used in BBBEM. Also for North Central Asia the new estimates of CO agree with the old Hao-inventory within the error range, while CO2 is much higher, probably because of a highly underestimated area burnt for Russia. This is reflected in a high upper bound in BBBEM. The ratio of CO to CO2 suggests that in our model a higher tendency to flaming combustion is assumed. Figure 5 2000 totals Figure 9 CO Hao CO BBBEM Tg June 2000 Figure 10 December 2000 Figure 11 MOZART-2 Conclusions and Outlook The three-dimensional global Chemistry Transport Model MOZART-2 (Model of OZone And Related Tracers, Brasseur et al., 1998) has been developed jointly at NCAR (National Center for Atmospheric Research, Boulder, U.S.) and the Max Planck Institute for Meteorology in Hamburg (MPI-Met), Germany. MOZART-2 is designated to study the tropospheric distribution and budgets of ozone and 63 other related chemical species. At MPI-Met MOZART-2 is run with meteorological reanalysis from the European Centre for Medium-Range Weather Forecasts ECMWF. The standard emission inventories are taken from the EDGAR database. • Input parameters needed for establishing reliable Biomass burning emission inventories have to be better determined. The biggest uncertainties are found to be information on area burnt and the fuel load of the burning vegetation. • Biomass burning emissions show a very high interannual variability. For an average inventory comparison with values from literature turn out to be quite difficult because here are no statistical databases available. Documentations of measurement campagnes for particular years with emphasis on extreme events like El Nino are not representative for average conditions. • Emission factors for the different chemical species are sensitive to different fire regimes: flaming and smoldering combustion. This feature will soon be included in our model BBBEM. • Global fire satellite products such as GLOBSCAR from ESA is now being implemented in BBBEM which will deliver a global consistent and high-resolution database in time and space for areas and specific vegeation burnt. • Near future research at MPI-Met will also focus on an interactive modelling approach for biomass burning. This will allow for reanalysis of past years’ chemical scenarios, where no data for emission inventories are available. satellite image by courtesy of OSEI /NOAA Andreae et al., 2001: Glob. Biogeochem. Cyc., in press Barbosa et al.,1999: Glob. Biogeochem. Cyc., Vol.13, No. 4 Brasseur et al., 1998: JGR, Vol. 103, D21 Hao and Liu, 1994: Glob. Biogeochem. Cyc., 8, 495-503 Lavoué et al., 2000: JGR, Vol. 105, D22 Mueller,1992: JGR, Vol. 97, D16 References contact: Judith J. Hoelzemann Max Planck Inst. f. Meteorology Bundesstr. 55 D-20146 Hamburg, Germany hoelzemann@dkrz.de