Download
1 / 19
190 likes | 362 Views
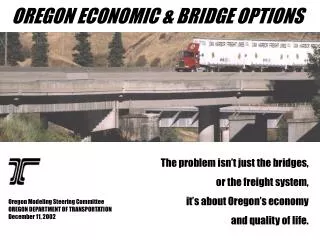
OREGON ECONOMIC & BRIDGE OPTIONS. The problem isn’t just the bridges, or the freight system, it’s about Oregon’s economy and quality of life. Oregon Modeling Steering Committee OREGON DEPARTMENT OF TRANSPORTATION December 11, 2002. Restricted/Cracked* Bridges - Today. Local Bridges.

E N D
OREGON ECONOMIC & BRIDGE OPTIONS The problem isn’t just the bridges, or the freight system, it’s about Oregon’s economy and quality of life. Oregon Modeling Steering Committee OREGON DEPARTMENT OF TRANSPORTATIONDecember 11, 2002
Restricted/Cracked* Bridges - Today Local Bridges State Bridges Sauvie Island Bridge Cole’s Bridge Ford’s Bridge * Medium and high crack density
Bridge Deterioration would initially Restrict Trucks over 80,000 lbs 1997 Oregon Commodity Flow Truck Survey
MODELING STATEWIDE ECONOMIC IMPACTS • Input:Load Limit bridge links in Transport Network • Define industry production of “Heavy Goods” • Modeled Impacts: • Flows: Heavy Trucks detoured - OR- • Heavy Trucks lighten loads to avoid restrictions • Costs: Increased Shipping costs • Increased Production costs • Location: Change industry location to reduce costs (in/out of state) • Loss of supporting service industries
Investment Options Level of 100% 30% 25% 20% 10% 5% 0% 4 Restrictions Today’s Post All Bridges Allow Deterioration Level of No Route 6 Restriction Restrictions I-5 and Restrict Restrict Not Not Not I-84 Restricted Restricted Restricted Freight Restrict Restrict Limited Not Not Routes Restricted Restricted Key State Restrict Restrict Limited Limited Not & Local Restricted Reg, Dist, Restrict Restrict Restrict Restrict Restrict & Local $0 $0 $2.3B $2.9B $3.7B $4.6B $4.7B $2.2B $3.1B $3.9B $4.1B $4.5B $4.8B $4.9B Bridge Investment 50-Yr NPF Initial Model Runs • Driven by Bridge Task Force • No US97 alternative • Functional classification-based • Little link to bridge costs
Model Results Statewide Impacts Lighter trucks avoid restrictions, increase truck trips Economic impact of up to $3B in 2025, $17B over 25-years Potential employment loss of 17,000 by 2025 Regional Impacts High shipping costs benefit locations near borders & urban areas Impacts those with highest shipping costs already (heavy goods industry, remote areas) Low shipping costs decentralizes activity Any investment improves state economy Investment location has regional consequences Portland/Willamette Valley - 75% of state production Livability Impacts Detours increased truck miles on unsuitable roads All options increase trucks in habitat/AQ areas
TOTAL AGFF WOOD TECH SERV Allow Deterioration Fix Interstates + Freight Routes +Key Local Routes Regional Production Relative to Current Mobility Option
Iterative Model Acceptance BOT Economic SubTeam(October) • Skepticism about unknown model results • Bury Model Results in Appendix Director’s Office(Early November) • Economic/Community impacts are paramount • Use absolute not relative model results • Limit investment options • 3 Futures/Courses of Action up-front • Flat Funding • Flat Funding/Buy Time (proactive posting) • Invest Now/Fix All
Met with Trucking Industry Representatives (November) Concerned with I-5 construction impacts/delays Backbone Freight Route for all trucks (quick/low cost) BOT Team (Late November) No recommendation? No US97 alternative? Add real-world stories Create Recommendation with US97 staging for I-5 work Model one of many tools that led to recommendation Iterative Model Acceptance
Staged Bridge Investment Open E-W, N-S Heavy Truck Routes ASAP (Replace on I-84, US97, S22) Incrementally address I-5 (Replace to S58 and link to US97, etc.) Routes with high cost/benefit Fix Bridges with unacceptable detours Maintain other key routes, restrict as needed Selected restrictions to extend bridge life Draft Recommendation
Use of Model • Identify the range of impacts • Fix All Bridges (Maximum investment) • Allow Deterioration • Proactively Restrict All Bridges • TBD -- restrict below 64,000 lbs. • Statewide Economic Impacts • Damping of State Economy • Employment/Population • Importance of Portland/Willamette Valley connections • Sub-State economic trends- industries and regions • Temper “sky is falling” approach • Local and impending statewide “crisis”
Lessons Learned • New Tool takes time to be accepted/used • Model should generate investment options, rather than support a priori expectations • Model validation/credibility is critical • Need to model “crisis” • Model is one of many inputs to process • Need time to digest/understand model findings • Relative measures difficult to understand
Role of OMSC OMSC • Credibility/validation of model structure • Past efforts using model OMSC Bridge Sub-Committee • Review/assist with model inputs/assumptions • Interagency review/comment on model output • Recommendations • Importance of Net Present Value and lifecycle analysis • Model output is an incomplete cost-benefit analysis • Suggest/prioritize additional model runs
OVERALL TIMELINE ODOT: Inspect bridges bi-annually or more often. 2001- cracks identified Bridge Task Force: Validate Problem, Emphasize Corridors June 2002 Dec 02 ODOT: Economic and Bridge Options Report Draft: Nov 02 Final: Jan 03 Jan 03 OTC OTC, Governor, Legislature: Select a strategy to address problem. 2003 ODOT: Develop implementation strategy. Implement. Track deterioration & priorities. 2003-2010