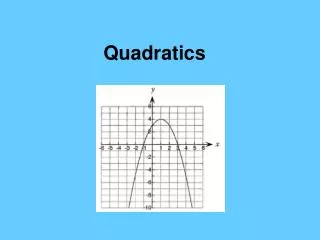
Quadratics and area investigation
160 likes | 290 Views
This investigation explores how to maximize the area of a fenced space for a racehorse with a limited perimeter of 120 meters. By analyzing various rectangular configurations, we find that a square shape (30m x 30m) offers the largest area of 900 m². The guide discusses the mathematical concepts behind maximizing area using quadratic equations, the relationship between length and width, and the significance of understanding these principles for efficient material usage. Key insights into the behavior of parabolic graphs and area equations are also provided.

Quadratics and area investigation
E N D
Presentation Transcript
Quadratics and area investigation By: Daniel F block
The situation: • You own a race horse named Dasher . You realize that he needs some space to roam around and relax. You decide to create a space for him in the grass area behind his stables. However there is one problem, you only have 120 m of material to make the fenced area. In what way can you maximize the area of space for Dasher has?
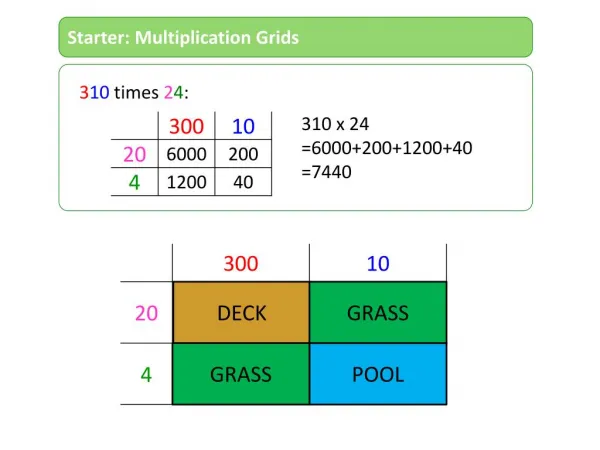
1. Examples of Rectangles: 30 m 10 m 50 m 30 m 30 m 50 m 10 m 30 m 15 m 35 m 45 m 25 m 45 m 25 m 35 m 15 m
4. Maximum Area and how it is determined Maximum Area: • The maximum area for the fixed perimeter (120m) is 900 m2 (30 by 30) How is it determined: • 900 is the highest point on the graph • 900 is highest in the table • Challenge: If there is a fixed perimeter then a square would always have the largest area compared to rectangles. This happens because it is 2 large numbers (30 and 30) multiplying by each other (squaring 30). No matter what number like (55 by 5) or (25 by 35) or even (29.5 by 30.5) would not have a bigger area.
5. Why would you want to know the maximum? • You want know the maximum area because you want to know at what point you would be maximising the use of your 120m’s of material. If you were to use my example knowing the maximum area would allow you to create the largest space possible for the horse to roam with your material. The more area you have and the less material you use will amount to you spending less money on the materials. • Companies that package things also think about maximising the volume in their boxes using the least material to save money.
6. X VALUES AND y VALUES x • 1 y-value has x2 or x*x values in it • The number of x (length) values that go into y (area) value is always the width • For every Y value there is always 2 x values because there are always 2 rectangles that have the same dimensions but in a different position (e.g. length: 10 and length: 50) which in the end has the same area. However there is only one instance that this is not the case and that is the square 30 by 30. The area is 900 m^2. This is the case because even if you put the square in a different position the length would still be 30 so there is only one shape of those dimensions and that means there is only one x value for one y value. That is why it is an arc because there is more than one x value for a y value (except for maximum). • Challenge: This is an example of a function because the dependent variable is affected by the independent variable. In a function there is only one output. In this case there is also only one output even though there is a possibility to have two inputs for the same output. It is also possible to make an equation and a graph which proves it is a function. Y x
7. Pattern in length of side and area • As the length increases we see a rise in the area as the difference between length and width is becoming smaller. The rise begins very steep and then starts to curve as the increase between points decrease. Then it reaches the maximum side length which is 30 (or the square). This is the largest the area will get (900 m2). Then as the length and width begin to separate and the difference between the 2 numbers becomes larger (width is becoming smaller and the length is becoming bigger) the area begins to get smaller. It decreases at the same pace it increased on the other side. Meaning it decreases slowly and then more steeply with each point as the difference between the points increase. This creates the parabola or arc shape in the graph. Now the graph is symmetrical (same on both sides of the maximum).
7. Why do we graph length against area and exclude the width (Challenge) 10 m 50 m • The main reason why you exclude width is that basically we are already using the width but in an interchangeable way with the length. Usually the length is known to be the longer side. However in this case we make it so that every possible side length within every 5 increments is the length. We could also exclude the length and make everything the width. As long as there is one axis and one independent variable (x-axis). E.g. Length 50 and Length 10 is the exact same rectangle just in a different position. • In the equation you have to have one x axis variable which is x in this case (L). 50 m 10 m = 10 m 50 m 50 m 10 m
(a)Express width in terms of length In terms of L: (P=2L+2W) 120=2L+2W 2L=120-2W L= 60-W In terms of W: (P=2L+2W) 120=2L+2W 2W=120-2L W= 60-L
(b) Equation to find area without WIDTH (w) Equation for Area : A = L x W W= 60- L Equation without W: A = L (60-L)
( c ) Checking equation Length 35m: (A=L(60-L)) A=35(60-35) A=35 x 25 A=875 m2 Length 10m: (A=L(60-L)) A=10(60-10) A=10 x 50 A=500 m2
Challenge: A=l(90-l) find area and perimeter P=2L+2(90-L) P=2L-2L+180 P=180 A= L (90-L) W=90-L P=2L+2W 180 ÷ 4= 45 Maximum Area: 2025 m2 (45 x 45)