Download
1 / 27
270 likes | 393 Views
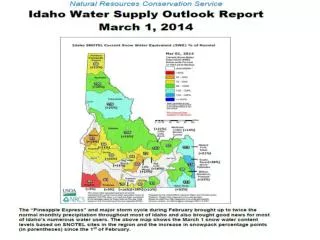
February SNOTEL Precipitation as % of Average. Idaho SNOTEL Precipitation March 1-14 compared to normal March Total are: 130% in Weiser 90-120% north, central, Upper Snake, Oakley, 60-75% Little Lost, Salmon Falls, Bruneau, Bear 81% Owyhee . February SWE Increase :

E N D
Idaho SNOTEL Precipitation March 1-14 compared to normal March Total are: • 130% in Weiser • 90-120% north, central, Upper Snake, Oakley, • 60-75% Little Lost, Salmon Falls, Bruneau, Bear • 81% Owyhee
February SWE Increase: Clearwater Basin - 2nd greatest February increase since 1981; only February 1999 had a bigger increase. Boise Basin - 4th greatest February increase since 1961; only years 1986, 1999, and 1972 received more. Snake abv Jackson Lake, Hoback, Greys, Salt, GrosVentre– 2nd greatest since 1961 only 1986 had more. Lewis Lake Divide – 5th highest February increase since records start in 1919
SNOTEL Site SQUAW FLAT – Weiser - Payette Divide 8” of precipitation since March 1
6.8” peak SWE 3.4” half melt Camas Creek near Blaine, on average, peaks 1 day before Soldier R.S. swe reaches half melt,
Snow Indexes with March 14 SWE Data compared to April 1 Indexes: Hoback 12th highest compared to April 1 index that starts in 1961 Greys 14thhighest compared to April 1 index that starts in 1961 Gros Venture 16thhighest compared to April 1 index that starts in 1961
February 1, 2014 Water Supply Forecasts, Amount Needed & Shortages Based on the 5 Exeedance Forecasts = Streamflow Needed Adequate Supply Reservoir Storage
March 1, 2014 Water Supply- Amount Needed, Shortages & Surplus Based on All Five Chance of Exceedance Forecasts
March 1, 2014 Water Supply- Amount Needed, Shortages & Surplus Based on All Five Chance of Exceedance Forecasts
March 1, 2014 Water Supply- Amount Needed, Shortages & Surplus Based on All Five Chance of Exceedance Forecasts
March 1, 2014 Water Supply- Amount Needed, Shortages & Surplus Based on All Five Chance of Exceedance Forecasts