Download
1 / 55
550 likes | 681 Views
Real-time Frame Selector 2 and Convective Structure in Emerging Flux Region. 高津 裕通. contents. (1) Real-time Frame Selector 2 (2) Local Correlation Tracking Method (3) Convective Structure in Emerging Flux Region (Hida data) (4) Convective Structure in Emerging Flux Region (LaPalma data).

E N D
Real-time Frame Selector 2 and Convective Structure in Emerging Flux Region 高津 裕通
contents (1) Real-time Frame Selector 2 (2) Local Correlation Tracking Method (3) Convective Structure in Emerging Flux Region (Hida data) (4) Convective Structure in Emerging Flux Region (LaPalma data)
浮上磁束管 コロナ 彩層 光球 (Shibata)
対流構造 粒状班を追え Feature Tracking or Correlation Tracking
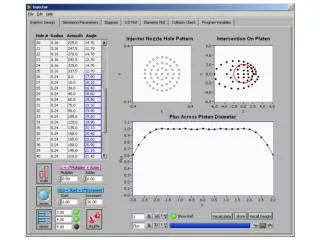
Data flow chart CCD images frame 1 comparing dispersion in ROI best image in this interval saved image selecting interval ROI ROI ROI frame 2 just captured image saving interval saved image selecting interval frame 3 capturing image saving interval storing saving selecting interval HDD time
(結論1)性能比較 • Frame rate15fps 30fps • 約半数の画像がよりよいものになる。 • CCD video camera CCD camera • AD/DA 変換ノイズの軽減 • Dark image のふらつき(強度標準偏差) 1.56 0.51 • FOV 120 arcsec2 240 arcsec2 • User interface text GUI
連続して撮像された多数の画像から、特定の構造(tracer)の移動距離を求める方法。Tracer の同定は、Intensity の相関(CC)を用いる。 こうして求めた変位には、見かけの動きやローカルな動きが含まれている 多数の和をとり、キャンセルする
displacement maps images + + + time velocity map displacement map
LCTM には、主に3つのパラメータがある (1) 箱の大きさ (Box) 何を tracer として選ぶか 目的とする速度場構造の大きさは?(2) 探索範囲 (Search) 移動速度と seeing の影響(3) 時間間隔 (Delta) tracer の寿命(粒状班なら5分程度) (2) Search (1) Box (3) Delta
評価方法(even-odd法) 画像 (Delta = 4 の場合) + + + + + = All 0 1 2 3 4 5 + + = Even 比較する + + = Odd 速度場 変位場
評価方法(reverse法) 画像 (時間正方向) + + + + + = All (時間逆方向) 比較する + + + + + = All 速度場 変位場
SOHO/MDI NOAA8582 movie
SOHO/MDI NOAA8582 ROI movie
Flux plot observation 4x10⁵ 2x10⁵ 0x105 11 Jun 0:00 14 Jun 06:24 18 Jun 14:00
Ha image with G-band contour (47x33 Mm) red - blue Ha center blue wing Ha-0.6A red wing Ha+0.6A
G-band image (47x33 Mm) and contour of 2 emerging flux loops
Horizontal Velocity map (100 min averaged) Max speed = 0.487 km/sec at (23,12)
37.5 min averaged divergence maps 21:24-22:02 21:37-22:14 21:49-22:27 22:02-22:39 22:14-22:52 22:27-23:04 movie
(結論3) • Lifetime of Meso-scale flow ~30--50 min • Divergence structure at emerging flux loops • Lifetime >100 min (~Strous et al 1996) • Size ~5 Mm (<Strous ~10 Mm) • Max horizontal velocity ~0.4km/sec (~Strous)
(4) Convective Structure in Emerging Flux Region LaPalma data
観測データ • La Palma Observatory (Spain) • NOAA 8218 (S20 W20) • 13th May 1998 12:45-16:35 UT, 3 hours 50 mins. • 4305Å G band • 411 images • Time resolution ~30 sec • Space resolution 0.1 arcsec/pixel • Ca II 3933Å K line • Fe I 6302Å LCP, RCP, continuum • Ha 6356Å, +/-350mÅ, -700mÅ
12:49:33 UT 16:09:36 UT G band data 1.4 万km ROI 2、8 万km
Ha flare location Brooks
評価方法(even-odd法) 画像 (Delta = 4 の場合) + + + + + = All 0 1 2 3 4 5 + + = Even 比較する + + = Odd 速度場 変位場
N/S e - o e even o odd | e – o | (N/S) == ∑ ∑ | e | + | o | 2 小さい程よい
DeltaによるN/Sの変化 1、5 Granule region Delta=4,6が最小 2 4 6 . . 20 Delta Box=5 Search=5→20 Delta=2→20 200 0 加算ファイル数
DeltaによるN/Sの変化 1、5 Granule region Delta=4,6が最小 Box=10 Search=5→20 Delta=2→20 200 0 加算ファイル数
DeltaによるN/Sの変化 1、5 Granule region Delta=4が最小 Box=15 Search=5→20 Delta=2→20 200 0 加算ファイル数
DeltaによるN/Sの変化 1、0 pore region Delta=16,18が最小 Box=5 Search=5→20 Delta=2→20 200 0 加算ファイル数
DeltaによるN/Sの変化 1、0 pore region Delta=18,20が最小 Box=10 Search=5→20 Delta=2→20 200 0 加算ファイル数
DeltaによるN/Sの変化 1、0 pore region Delta=16が最小 Box=15 Search=5→20 Delta=2→20 200 0 加算ファイル数
パラメータ探索結果 • Granule region では • Box=20 が最もよい • Box の大きさにかかわらず、Delta=4 が最もよい • N/S は 0.3 程度 • Pore region では • box=5 が最もよい • Delta=16 ー20、 ばらつきがある。←ウソ • N/S は 0.2 程度
Velocity Field (granule 3) granule region 粒状班による湧き出し構造がよくわかる Ave. Vel. 0.172 km/sec Max Vel. 0.489 km/s N/S 0.608 Box=10 Search=5 Delta=4 Max Vel.
N/S (granule 3) granule region 場所によってはやや精度が落ちる Ave. Vel. 0.172 km/sec Max Vel. 0.489 km/s N/S 0.608 Box=10 Search=5 Delta=4 Max Vel.
Velocity Field (pore 7) pore region 浮上磁場領域の発散構造が見える Ave. Vel. 0.078 km/sec Max Vel. 0.542 km/s N/S 0.239 Box=10 Search=5 Delta=4 Max Vel.
N/S (pore 7) pore region 浮上磁場領域の精度はよい(granuleを見ている) Ave. Vel. 0.078 km/sec Max Vel. 0.542 km/s N/S 0.239 Box=10 Search=5 Delta=4 Max Vel.
Granule regionでは • Delta=4 (2分) • Box は目的とする解像度によるが、大きい方が精度はよい。 • この領域での平均速度は、0.16 km/sec、 精度は30% • Pore region では • Delta=16-20 (8-10分) 4(2分) • Box=5 (0.5 arcsec) • 平均速度は、0.19 km/sec、精度は、20% • even-odd 法で、少なくとも Delta は決定できることが分かった。Reverseによる検定が必要
1 4 5 2 6 7 3 最大速度 1.68 km/sec 平均速度 0.47 km/sec 誤差 20-30 %
(結論4) EFR == 湧き出し??
1/30 sec 1/15 sec Quality of image time