Download
1 / 8
100 likes | 277 Views
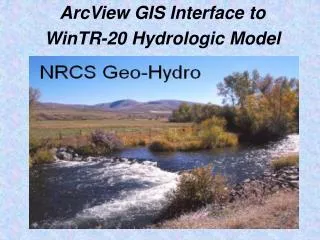
Hydrologic Model Preparation for EPA SWMM modeling Software Using a GIS. Robert Farid CEE 424 GIS for Civil Engineers. Purpose The purpose of this study is to test the viability of using a Geographic Information System (GIS)

E N D
Hydrologic Model Preparation for EPA SWMM modeling Software Using a GIS Robert Farid CEE 424 GIS for Civil Engineers
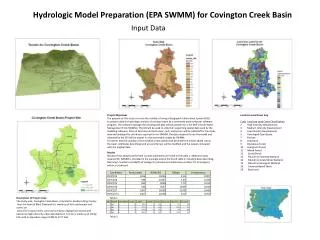
Purpose The purpose of this study is to test the viability of using a Geographic Information System (GIS) to prepare data for hydrologic analysis of a stream basin by a commonly used computer software program. The software package the resulting GIS data will be ported into is the EPA’s Storm Water Management Tool (SWMM). The GIS will be used to collect all supporting spatial data used by the modeling software. Data on land use and land cover, soils, and terrain will be collected for the study area and analyzed for attributes required to run SWMM. The data required to run the model and collected by the GIS will be output in a format readily usable by SWMM. To further test the usability of the method a new commercial development will be added within the basin. Attributes describing land use and terrain will be modified and the output compared with the original data.
Description of Project Area The study area, Covington Creek Basin, is located in Southern King County near the town of Black Diamond It is made up of five catchments and covers an area of 6.5 square miles. Land use is mixed, ranging from woods and pasture to high intensity urban development. Terrain is made up of rolling hills with an elevation range of 480 to 1177 feet.
Soils Data • Data source: USDA SSURGO soils. • Data clipped to project boundary. • Soils data categorized by transmisivity. • SWMM uses four data categories A-D.
Land Use Land Cover • Source data: NOAA Costal Change Analysis • Project 2006 (Landsat 30 meter pixel). • Data converted from rater to polygon. • Clipped to project boundary. • Addition of LU/LC related attributes used by • SWMM added. • Unioned with Soils layer. • Analysis performed to populate • attribute table. • Data table output in asciiformat.
Terrain • Data source: USGS 10 meter DEM’s. • Import into ArcGIS, Mosaic, • and clip to project boundary. • Convert to TIN in order to find slope. • Convert TIN to polygon for access • to attribute table of slope values. • Calculate average slope percent.
Results Results of the analysis performed on each catchment are listed in the table 1. Additional data required for SWMM is provided in the example output file found table 2, including data describing Manning’s numbers and depth of storage for pervious and impervious surfaces for all polygons within a catchment. Table 1. Table 2.
Conclusion • Data for hydrologic models is often captured in spreadsheet programs like Excel. Tables for each category of data are constructed and associated using Pivot tables and Excel’s data base functionality. While this method works it is cumbersome, non-intuitive, and difficult to update. • Capturing the same data in a GIS has many advantages. • All of the data is spatial and is intuitively easy to work with as a map layer. • Data comes pre-associated as soils or land use information tied to a map. Each layer’s attributes • can be modified and remains associated with that layer. • Layers can easily be “Unioned” together combining attributes and calculating the area of their • properties, something Excel is unable to do. • As information within the study area changes it is easy to call up the appropriate layer, modify it • and rerun the analysis. • Since all of the data exists within the GIS it has the added ability to portray it as a thematic or • presentation map. • A GIS is a convenient and powerful tool for collecting data and performing analysis. It readily performs complex calculations on large datasets and acts as an effective organizing system for all of a project’s spatial information.