Download
1 / 39
390 likes | 649 Views
2013 Drought and Seasonal Temperature and Precipitation Outlook for the Ark-La-Tex Region. Jason Hansford Senior Meteorologist National Weather Service Forecast Office Shreveport, LA. U.S. Drought Monitor (Six Month Comparison). August 28, 2012. March 19, 2013.

E N D
2013 Drought and Seasonal Temperature and Precipitation Outlook for the Ark-La-Tex Region Jason Hansford Senior Meteorologist National Weather Service Forecast Office Shreveport, LA
U.S. Drought Monitor (Six Month Comparison) August 28, 2012 March 19, 2013
Six Month Rainfall MapLate September 2012 - March 26th, 2013 Observed Rainfall: Departure from Normal:
Twelve Month Rainfall MapMarch 26th- March 25th, 2012-13 Observed Rainfall: Departure from Normal:
11+ Month Rainfall and Departures (Apr. ’12 - Mar. 13th,‘13)
Southern Plains Yearly Average Temperature and Departure from Normal
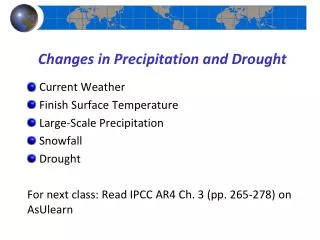
Winter Rains Have Eased Drought Conditions(December 2012 - February 2013)
Hydrologic Drought(Lake Pool Stage as of 3/26/13) Broken Bow: 601.16 ft (+1.66 ft) Millwood: 259.67 ft (+0.47 ft) Wright Patman: 223.78 ft (+3.18 ft) Lake O’ Pines: 225.48 ft (-3.02 ft) Caddo Lake: 169.10 ft (-0.90 ft) Lake D-Arbonne: 80.88 ft (-0.12 ft) Toledo Bend: 169.40 ft (-2.60 ft) Lake Fork: 398.59 ft (-4.41 ft) Sam Rayburn: 162.45 ft (-2.05 ft)
Hydrological Drought Impacts BROKEN BOW LAKE November 22, 2012 Measured Pool Stage at 7am: 589.55 Feet Normal Pool Stage: 599.50 Feet
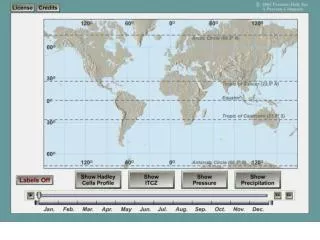
What Factors Have Contributed to the Drought??? • We must look at sustained temperature patterns in the Equatorial Pacific, stretching along the equator from 170W to 120W longitude, and 5N to 5S latitude. • Based on certain temperature patterns over a period of time, El Niño or La Niña episodes may develop, which will alter the path of the jet stream, and ultimately determines temperature and precipitation patterns all over the world.
What is El Niño? • Operational Definition: defined by a warming of Sea Surface Temperatures (SST’s) in the Equatorial Pacific. This phenomenon is characterized by a trend of the 3 month running mean of SST’s 0.5C above normal. • SST’s are measured across various regions in the Pacific, but the Niño 3.4 Region (5°N – 5°S and 170°-120°W) is what is particularly monitored for ENSO conditions. • To be classified as a distinct El Niño episode, these SST conditions must be met for a period of at least 5 consecutive months.
What is La Niña? • Operational Definition: defined by a cooling of Sea Surface Temperatures (SST’s) in the Equatorial Pacific. This phenomenon is characterized by a trend of the 3 month running mean of SST’s 0.5C below normal. • Just like El Niño, SST’s are measured across various regions in the Pacific, but the Niño 3.4 Region (5°N – 5°S and 170°-120°W) is what is particularly monitored for ENSO conditions. • To be classified as a distinct La Niña episode, these SST conditions must be met for a period of at least 5 consecutive months.
SST’s in the Equatorial Pacific Niño 3.4 Region: 5°N - 5°S and 170° - 120°W [ ] [ ]
How Strong will ENSO be this Spring? Strong El Niño Neutral Strong La Niña Model Forecasts
What if we maintain neutral conditions for much of the year???
Arctic Oscillation • Refers to the atmospheric circulation pattern in the northern middle and high latitudes in the Arctic. These can generate strong shifts in the climate pattern than can overwhelm or amplify the typical El Niño/La Niña impacts. • Exhibits a negative phase when higher pressures develop over the Polar region, and low pressures develop in the mid- latitudes (near 45°N). This results in frigid air plunging south into North America east of the Rockies. • Exhibits a positive phase when lower pressures develop over the Polar region, and higher pressures develop in the mid- latitudes. This will keep the frigid air locked up in the Arctic region, but also drives ocean storms farther north. Thus, wetter weather is usually associated throughout Alaska, Scotland, and Scandinavia.
Arctic Oscillation (1950 - Current) Limitations to Forecasting: Strong AO episodes typically last only a few weeks, and are difficult to predict more than a week or two in advance.
North Atlantic Oscillation • Fluctuations in the difference of sea-level pressure between the Icelandic Low and the Azores high. • + NAO prevents cold air from plunging southward over eastern North America. • Shows multi-decadal signal. • Has an effect on Hurricanes in the Atlantic. (During +NAO events, the Bermuda High is weaker, allowing for a more W-E flow across the Atlantic. SST’s in the Atlantic are also unusually cold following +NAO winters.)
Historical NAO Index(1950-Current) Strong positive anomalies last winter. Strong negative anomalies this winter.
Monthly Observed Arctic and North Atlantic Oscillation Indices
AO/NAO Influences on the Average Temperatures across the CONUS
Drought Severity Indices • Palmer Drought Severity Index: Is most effective in determining long termdrought by using temperature and precipitation to calculate dryness. It is also standardized to the local climate. • Measured on a scale of -4 to 4, with negative values indicating drought, and positive values indicating moisture surplus. • Crop Moisture Index (CMI): Is a short term drought index, based on precipitation, dryness, and wetness affecting agriculture. It changes more rapidly from week to week than the Palmer Index. • Uses the same scale as the Palmer Index.
Calculated Soil Moisture Soil Moisture is 400 - 550 mm (15.5 – 21.5 in.) deep. That’s 50-100 mm (2.0 - 4.0 in.) BELOW normal!
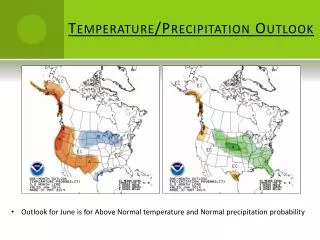
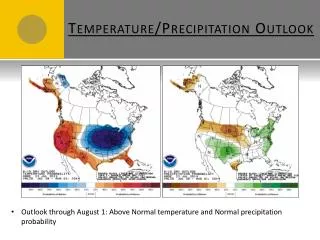
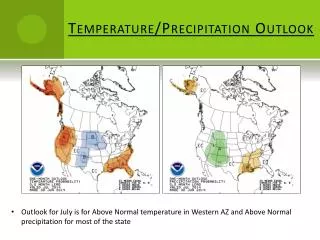
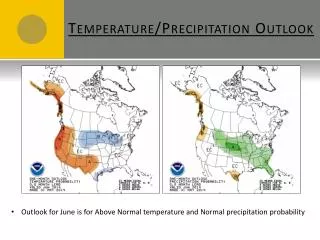
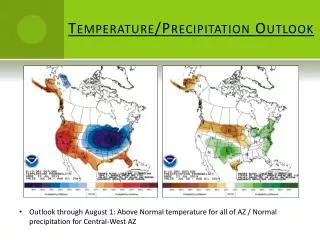
Spring Outlook Issued by the Climate Prediction Center
The End Any Questions???