SOLUTION
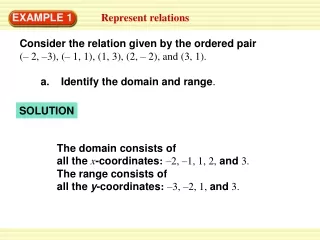
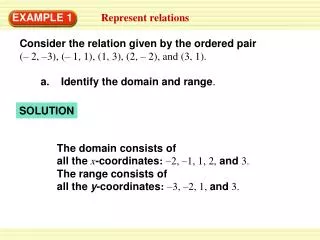
The domain consists of all the x -coordinates : –2, –1, 1, 2, and 3. The range consists of all the y -coordinates : –3, –2, 1, and 3. EXAMPLE 1. Represent relations.

SOLUTION
E N D
Presentation Transcript
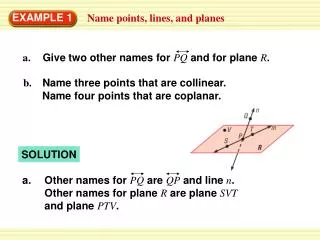
The domain consists of all the x-coordinates:–2, –1, 1, 2,and3. The rangeconsists of all the y-coordinates:–3, –2, 1, and 3. EXAMPLE 1 Represent relations Consider the relation given by the ordered pair (– 2, –3), (– 1, 1), (1, 3), (2, – 2), and (3, 1). a.Identify the domain and range. SOLUTION
b. Represent the relation using a graph and a mapping diagram. EXAMPLE 1 Represent relations SOLUTION b. Graph Mapping Diagram
The relation isa function because each input is mapped onto exactly one output. a. Identify functions EXAMPLE 2 Tell whether the relation is a function. Explain. SOLUTION
b. The relation isnota function because the input 1 is mapped onto both – 1 and 2. Identify functions EXAMPLE 2 Tell whether the relation is a function. Explain. SOLUTION
Basketball EXAMPLE 3 Use the vertical line test The first graph below plots average points per game versus age at the end of the 2003–2004 NBA regular season for the 8 members of the Minnesota Timber wolves with the highest averages. The second graph plots average points per game versus age for one team member, Kevin Garnett, over his first 9 seasons. Are the relations shown by the graphs functions? Explain.
Use the vertical line test EXAMPLE 3 SOLUTION The team graph does not represent a function because vertical lines at x=28 and x=29 each intersect the graph at more than one point. The graph for Kevin Garnett does represent a function because no vertical line intersects the graph at more than one point.
Graph an equation in two variables EXAMPLE 4 Graph the equationy= – 2x–1. SOLUTION STEP1 Construct a table of values.
Graph an equation in two variables EXAMPLE 4 STEP 2 Plot the points. Notice that they all lie on a line. STEP3 Connect the points with a line.
a. f (x) = – x2 – 2x + 7 The functionfis not linear because it has an x2-term. EXAMPLE 5 Classify and evaluate functions Tell whether the function is linear.Thenevaluate the function when x= – 4. SOLUTION f (x) =–x2– 2x+ 7 Write function. f (– 4) =–(– 4)2– 2(– 4) + 7 Substitute–4forx. Simplify. =–1
The function gis linear because it has the form g(x) = mx + b. b. g(x) = 5x + 8 EXAMPLE 5 Classify and evaluate functions SOLUTION g(x) = 5x+ 8 Write function. Substitute –4 forx. g(–4) = 5(–4) + 8 Simplify. =– 12
EXAMPLE 6 Use a function in real life Diving A diver using a Diver Propulsion Vehicle (DPV) descends to a depth of 130 feet.The pressure P(in atmospheres) on the diver is given by P(d) 5 1 + 0.03d where dis the depth (in feet). Graph the function, and determine a reasonable domain and range. What is the pressure on the diver at a depth of 33 feet?
The graph ofP(d) is shown.Because the depth varies from0feet to130feet, areasonable domain is0d130. The minimum value of P(d)isP(0) = 1, and the maximum value of P(d)isP(130) = 4.9. So,a reasonablerange is 1P(d) 4.9. < < < < Use the vertical line test EXAMPLE 6 SOLUTION
ANSWER At a depth of 33 feet, the pressure on the diver is P(33) = 1 + 0.03(33) 2 atmospheres, which you can verify from the graph. Use the vertical line test EXAMPLE 6
A skateboard ramp has a rise of 15 inches and a run of 54 inches. What is its slope? rise slope = run 5 5 15 18 18 = = 54 ANSWER . The slope of the ramp is EXAMPLE 1 Find slope in real life Skateboarding SOLUTION
m = y2–y1 – 1 –3 = x2–x1 2–(–1) 4 ANSWER 3 = The correct answer is A. EXAMPLE 2 Standardized Test Practice SOLUTION Let (x1, y1) =(–1, 3) and (x2,y2)=(2, –1).
a. (– 5, 1), (3, 1) b. d. c. (– 6, 0), (2, –4) (4, 6), (4, –1) (–1, 3), (5, 8) 0 a. b. m = m = = 0 – 4–0 1–1 8 = = 3– (–5) 2– (–6) 1 – 4 = 2 8 – EXAMPLE 3 Classify lines using slope Without graphing, tell whether the line through the given points rises, falls, ishorizontal, or is vertical. SOLUTION Because m = 0, the line is horizontal. Because m < 0, the line falls.
5 – 7 6 0 c. d. m = m = – 1–6 8–3 = = 5– (–1) 4 – 4 EXAMPLE 3 Classify lines using slope Because m > 0, the line rises. Because mis undefined, the line is vertical.
a. Line 1: through (– 2, 2) and (0, – 1) Line 2: through (– 4, – 1) and (2, 3) b. Line 1: through (1, 2) and (4, – 3) Line 2: through (– 4, 3) and (– 1, – 2) –1 – 2 = a. Find the slopes of the two lines. 0– (– 2) 3 – 3 2 = – m1 = 2 EXAMPLE 4 Classify parallel and perpendicular lines Tell whether the lines are parallel, perpendicular, or neither. SOLUTION
3 2 4 = m2 = 2 3 6 ANSWER = – 1, m1 and m2 Becausem1m2= – are negative reciprocals of each other. So, the lines are perpendicular. 3 – (– 1) = 2– (– 4) 2 3 EXAMPLE 4 Classify parallel and perpendicular lines
– 2 – 3 – 5 = = m2 = – 1– (– 4) 3 ANSWER Because m1=m2 (and the lines are different), you can conclude that the lines are parallel. –3 – 2 = b. Find the slopes of the two lines. 4– 1 5 5 – 5 3 3 = – – m1 = 3 EXAMPLE 4 Classify parallel and perpendicular lines
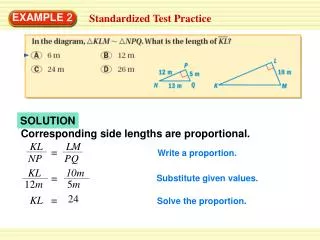
EXAMPLE 5 Solve a multi-step problem Forestry Use the diagram, which illustrates the growth of a giant sequoia, to find the average rate of change in the diameter of the sequoia over time. Then predict the sequoia’s diameter in 2065.
Change in diameter Average rate of change = Change in time 141 in. – 137 in. = 2005 – 1965 4 in. = 40 years EXAMPLE 5 Solve a multi-step problem SOLUTION STEP 1 Find the average rate of change. =0.1inch per year
ANSWER In 2065, the diameter of the sequoia will be about 141 + 6 = 147 inches. EXAMPLE 5 Solve a multi-step problem STEP 2 Predict the diameter of the sequoia in 2065. Find the number of years from 2005 to 2065. Multiply this number by the average rate of change to find the total increase in diameter during the period 2005–2065. Number of years = 2065 – 2005 =60 Increase in diameter =(60years) (0.1inch/year) = 6 inches