Download
1 / 24
280 likes | 515 Views
This presentation discusses watershed perspectives in policy, Total Maximum Daily Load (TMDL), GIS data for watershed characterization, tools for delineation and analysis, and examples for classroom and research. It explores environmental mandates, issues in policy, and the use of GIS in managing land and water quality. The process of watershed delineation, including fill sinks, flow direction, flow accumulation, and defining watersheds, is explained. Various datasets and tools like BASINS for water quality modeling are highlighted. Additionally, the presentation touches on stream networks, downstream impact analysis, land use assessment, and watershed parcel characterization. The importance of these tools in teaching public policy in the earth sciences is emphasized.

E N D
GIS Tools for Watershed Delineation Public Policy Perspectives Teaching Public Policy in the Earth Sciences April 21, 2006 Gary Coutu Department of Geography and Planning West Chester University
Contents • Watershed Perspectives in Policy • Environmental Mandates • GIS Data for Watershed Characterization • Tools for Watershed Delineation and Analysis • Examples for Classroom and Research • Issues
Watershed Perspectives in Policy Many Agencies support data and model development for environmental assessment, management and mitigation • Watershed- EPA approach for managing land and water quality • TMDL: Total Maximum Daily Load • 303d List of Impaired Waters • EPA Support- Data, GIS tools and Models • Issue- National data sets versus local information and data
Environmental Perspectives • TMDL (Total Maximum Daily Load): calculation of the maximum amount of a pollutant that a waterbody can receive and still meet water quality standards. Established in the Clean Water Act, section 303. Section 303(d) of the Clean Water Act Under section 303(d) of the 1972 Clean Water Act, states, territories, and authorized tribes are required to develop lists of impaired waters. These impaired waters do not meet water quality standards that states, territories, and authorized tribes have set for them, even after point sources of pollution have installed the minimum required levels of pollution control technology. The law requires that these jurisdictions establish priority rankings for waters on the lists and develop TMDLs for these waters. http://www.epa.gov/owow/tmdl/overviewfs.html
Total Maximum Daily Loads on the Web TMDLs and the 303d list are developed concurrently. EPA publishes information and local links on their web site. Reporting and analysis: Based upon a large set of spatial data for watershed and stream locations. Most of this data developed by USGS USGS Data: Hydrologic Units National Hydrography Dataset Stream Gauges
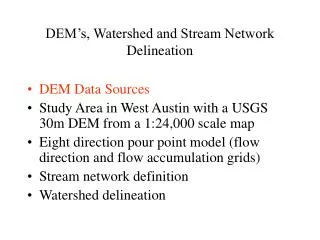
GIS Data for Watershed Characterization DEM: Digital Elevation Model. Grid of elevation points (each cell has an elevation value HUs: Hydrologic Units. Nested watershed units NHD: National Hydrography Dataset. Networked streams and features for modeling (includes human and natural waterways, damns, ponds, etc.) USGS Gauging Station Data
Hydrologic Unit Maps Represent watershed areas used for policy and environmental analysis/management • Regions (21 major geographic areas) • Sub-regions (222 subregions) • Accounting units (352 hydrologic units) • Cataloging units (2150 SubBasin) Hydrologic Unit Code (HUC): Consists of two to eight digits. The 6 digit accounting units and the 8 digit cataloguing units are generally referred to as basin and sub-basin. Two new levels, watershed and subwatershed, are under development.
Nested Hydrologic Units All Federal and State Agencies use this nested hierarchy Sample Watershed for this Presentation (560 Acres) 0204020535 (Upper Reach Brandywine Creek) 02040205 (Brandywine-Christiana) 020402 (Lower Delaware) 0204 (Delaware)
National Hydrography Datasests GIS layers (ArcGIS Geodatabase) stored as a Microsoft Access Database
BASINS: Water Quality Model Better Assessment Science Integrating Point & Nonpoint Sources: Environmental analysis system integrating GIS, national watershed data, and environmental assessment and modeling tools.
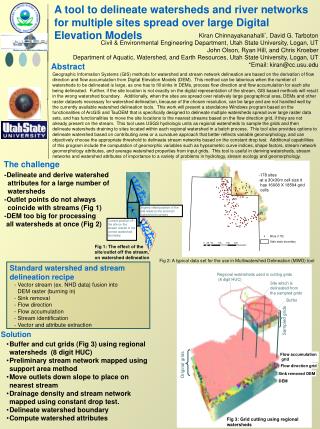
Watershed Delineation Process • Foundation of watershed analysis in the classroom • Steps: • Fill Sinks • Flow direction • Flow Accumulation • Define Watershed • Analysis
Delineation Process: Fill Sinks Sink: Cells of the DEM that do not drain Sinks Issue: Watershed commands won’t work Teaching: Students are exploring limitations of modeling
Delineation Process: Flow Direction/Accumulation Flow Direction: Assigns Direction of flow from cell to next lowest elevation (D-8 algorithm) Flow Accumulation: Total number of cells flowing into that cell (Can calculate streams and ridges)
Delineation Process: Use/Interpretation Flow Direction: Identify Water Flow Slope Flow Accumulation: Generate Streams
Delineation Process: Watershed Watersheds represent the drainage area to a point (known as the “pour point”.) Delineation tools allow a user to define the watershed for a selected drainage. Pour point at Stream confluence
Watershed Delineation: Use/Interpretation Data sets can be clipped for local watershed areas for analysis DEM Contours Steep Slopes
Stream Network Modeling Stream networks from the National Hydrography Dataset can be included in watershed analysis. Stream, watershed and land use data are used to explore environmental impact. Downstream Impact Watershed Parcels Commercial Site Impact
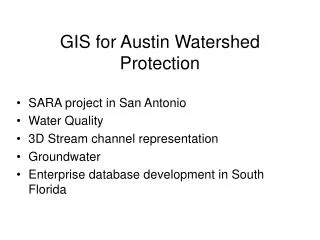
Land use/Water Quality Land use within a watershed can be isolated and quantified:
Watershed Characterization Students perform this analysis and tasks as part of a watershed study. Could be combined with field work.
Example Issue: DEM Resolution and Stream Layer Accuracy • DEM Resolution (10 meter vs 30 meter) • DEM Generated Stream Accuracy • Stream confluence and DEM confluence mis-match 30m DEM Stream 10m DEM Stream Student Experience: • Resolution/Scale Issues • Stream Map Generation • Field Data Integration • Context of Modeling Confluence 10m DEM
Web Sites • EPA Surf Your Watershed: • http://www.epa.gov/surf/ • EPA TMDL: • http://www.epa.gov/owow/tmdl/intro.html • EPA BASINS: • http://www.epa.gov/OST/BASINS/ • USGS DEM: • http://www.usgsdigital.com/Elevation.htm • USGS Stream Gauges: • http://water.usgs.gov/nsip/ • National Hydrography Data: • http://nhd.usgs.gov
Contact Gary Coutu Department of Geography and Planning West Chester University West Chester, Pennsylvania Email: gcoutu@wcupa.edu