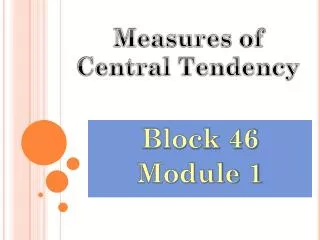
Module 46
Module 46. Data Analysis Grades 3 – 5 Sandra Trotman. Introduction & Review. Connecting with the standards: NGSSS Benchmarks for Grades 3 – 5 MA.3.A.4.1 Create, analyze, and represent patterns and relationships using words, variables, tables and graphs.

Module 46
E N D
Presentation Transcript
Module 46 Data Analysis Grades 3 – 5 Sandra Trotman
Introduction & Review • Connecting with the standards: NGSSS • Benchmarks for Grades 3 – 5 • MA.3.A.4.1Create, analyze, and represent patterns and relationships using words, variables, tables and graphs. • MA.3.S.7.1 Construct and analyze frequency tables, bar graphs, pictographs, and line plots from data, including data collected through observations, surveys, and experiments.
Show what you Know! Participants will complete a 5 item Diagnostic test on Data Analysis in elementary school.
Reflections Take a minute to reflect on this assessment. Questions • Were some problems easier than others? • What factors made them easier? • What do you want to learn more about in order to help children understand data analysis?
Reasons for including Data Analysis in Grades 3 - 5 • Children encounter ideas of data Analysis outside of school every day • Data Analysis provides opportunities for computational activities in a meaningful context • Data Analysis provides opportunities for developing collaborative and critical thinking skills
Steps of Data Analysis Instructional programs should enable students to:
Common Misunderstandings • Students may: • Experience confusion about the meanings of concepts • Lack of familiarity with terminology • Lack of familiarity with different symbols or problem situations • Question: Are there other misunderstandings that children may have about data analysis?
Vocabulary Power • Using Graphic Organizer to review vocab. for this lesson
Vocab. Strategy: Morphemic Analysis To write To paint Pictograph Template: http://www.beaconlearningcenter.com/documents/2351_5255.pdf
Let’s find out! Objective: To plan and conduct a survey Steps: • Think of a question you would like to answer: • Questions about yourselves • Questions about opinions or feelings • Questions about the world • …(Your input/suggestions) • Plan the survey by answering these questions. • Where or from whom will I collect the data? • How will I collect the data? • Your turn…. • Collect data
Activity 4: Integrating mathand Literature • Book: “The best vacation ever” by S. J Murphy. NY: 1997 “ A girl with an active, overscheduled family puts math to work to coordinate a family expedition. She uses charts to plot her family’s preferences.
Data Collection • Activity 5 Collection Methods • Activity 6 Using Pictographs • Math Forum. http//mathforum.org/mathtools (applets for use in generating data to graph) • Super teacher worksheets. a graph. http://www.superteacherworksheets.com/pictograph/elm-street-picto.pdf
Review Discuss what format may be used to complete a review of this session/lesson. It’s your turn to add to this slide!! Suggestions
Module 47 Graphing Data
Benchmarks • MA. 3. A.4.1 Create, analyze, and represent patterns and relationships using words, variables, tables and graphs. • MA.3.S.7.1 Construct and analyze frequency tables, bar graphs, pictographs, and line plots from data, including data collected through observations, surveys, and experiments. • MA. 5. A.4.2 Construct and describe a graph showing continuous data, such as a graph of a quantity that changes over time. • MA. 5. A.7.1 Construct and analyze line graphs and double bar graphs. • MA. 5. A.7.2 Differentiate between continuous and discrete data and determine ways to represent those using graphs and diagrams.
Vocab.: Using Venn Diagrams • Sort the review words into the Vann diagram. Graphs Tables
Activity: Completion Complete the sentences using the list of words. • Participants will create a sentence completion activity that students use to develop vocabulary power. • For example, The first value in an ordered pair is the _____________ . (x-coordinate)
A Search for Patterns • Early work on graphs can begin with a search for patterns. • Use cubes to continue a pattern • Number sequence (Odd numbers; Even numbers) • Symbols • Growing patterns • Encourage critical thinking
Growing Patterns • Using Cubes or Connecting Cubes
Creating Graphs Key features • Write a clear and descriptive title. • Use a uniform scale • Mark categories clearly • Make bars the same width • Write a legend or a key • Question: • Why is it important for the bars in a Bar graph to be the same width?
Double Bar Graphs • On a Double Bar graph, each set of bars uses a different scale. Is this graph useful? Explain!
Choosing an Appropriate Graph • Which type of graph is appropriate for displaying discrete data, and which for displaying continuous data?
Discrete Data • Discrete data has a countable number of values and can often be classified into categories. • Tuesday’s attendance at the movie • What data is counted? • Into what categories is the data classified?
Continuous Data • Continuous data can be measured with and ‘broken’ down into smaller increments and still have meaning. • Make a table to show the length of each participant’s hand span(Pinkie to the thumb). 0 5 10 15 cm • The lengths can be shown on a number line using smaller units such as mm.
Discrete vs. Continuous Data • Susie is growing a lima bean plant for a science experiment. She measures the height of the plant each day at the same time and records her data in a table. STOP & THINK! • Could the data be measured by using smaller units? • Is the data counted? • Is the data collected continuous or discrete? • Jason is bird watching. He marks a tally for each bird he sees. At the end of the day, he counts the total number of tally marks for each species of bird and records the numbers in his journal. STOP & THINK! • Could the data be measured by using smaller units? • Is the data counted? • Is the data collected continuous or discrete?
Bar Graphs • Mostly used for discrete or separate and distinct data • Each bar represents part of the data or the category • The length of the bar shows the number of counted values for that category • Easy to interpret; often use for quick, visual comparisons of categories of data
Using Technology Participants will: • Discuss how these tools might be used with their students. • 2. Use the tools, and then re-evaluate the benefits to be derived from incorporating the use of such tools in their instructional process. • 3. Suggest alternative tools and websites that may be used to teach data collection and representation.
Creating a Bar Graph • Participants will be given with raw data from a Bar graph and ask to recreate the graph without seeing the original graph. • Participants will compare their graph with the original graph discussing any differences between the two graphs.
Activity Card: DETERMINATION Purpose: Meeting individual needs to collect and organize data. • Give students a series of cards spelling the word DETERMINATION for them to make as many 2, 3, 4, 5, and 6 digit words. • Students will complete the table by writing each word under the correct number of letters. • Students will shade the number of words made in each column. • Students will write at least 2 sentences to describe what they have just created.
Quick & Easy Graphing Materials • Using Connecting Cubes • Counters in an ice tray/egg carton (Yes/No) • Paper clips or interlocking links • Self sticking notes/Post its
Modeling: Using appropriate intervals Emphasize • Choose a scale and interval that fit the data • You do not always have to begin your scale with 0. Activity: • Model making a line plot for the following data: 40, 31, 20, 32, 61 Questions: • What numbers determine the line’s end points? (20 and 61 or the least and the greatest numbers from the data) • Into what interval would it be best to divide the line? units of 10 (Explain!) The difference between the numbers are 20, 30, 40…60 is an outlier • Give one reason why we should use a line plot to organize data. (see range and clustering of data)
Review I It’s your turn to add to this slide!! Suggestions !! Thank you for participating in this session.
Module 48 Analyzing and Interpreting Data Analyzing and Interpreting Data
Benchmark • MA. 3. A.4.1 Create, analyze, and represent patterns and relationships using words, variables, tables and graphs. • MA. 3. A.4.2 Construct and describe a graph showing continuous data, such as a graph of a quantity that changes over time. • MA.3.S.7.1 Construct and analyze frequency tables, bar graphs, pictographs, and line plots from data, including data collected through observations, surveys, and experiments.
Module 48 Objectives • Participants will: • Discuss what is data sense and how is it developed • Identify goals for teaching Data Analysis in the elementary mathematics curriculum • Interpret pictographs and bar graphs • Analyze and compare different graphs that show the same information • Use different strategies and technology to solve problems • Create an assessment rubric to assess student level of strengths and weaknesses in Data Analysis
Reviewing and Extending Collecting and Organizing Data From concrete to symbolic representation • Begin by working with concrete objects in the environment • Example: Favorite fruit Collect, count and sort fruits into categories, then display them in an organized fashion
Concrete to Symbolic representation • Move to the Pictorial representation Draw the selected fruit on an index card and form a chain to build a pictograph • Express the same information more symbolically by using a bar graph • Additionally, give students a blank paper and encouraged to organize and report their data on the page in a way that makes sense to them.
Data Sense • What is data sense and how is it developed?” • “What should be the goal for teaching Data Analysis?”
Reading the data. Students can answer specific questions to which the answer is prominently displayed. Example, Which bar is the highest? • Reading between the data. Students can fins relationships in the data, such as comparison. Example, How many students prefer chocolate to vanilla ice cream? • Reading beyond the data. Student can predict or make inferences. Example, What shoe size sells the most? The least? What advice can you give to the show shop owner about purchasing shoes.
Data Analysis Word Wall Participants will develop a Word Wall for students to refer to when describing the shape and important features of a set of data, and comparing related data sets Data Maximum Range Minimum Most Scale Increase Decrease
Reading Graphs Critically Participants will propose and justify conclusions that are based on the data. (E.g., Why the data look the way they do?)
Interpreting Graphs • Questions: • What do you notice about the graph, the shape of the data in the graph, predict outcomes or what the data might be. Encourage students to: • Explain • Describe • Analyze
Problem Solving Tips An appropriate problem solving environment provides opportunities for questioning: • What information in the graph is not needed to answer a question? • How can making a model help you find the range of a problem? (Pictograph/key) • How can making a list help you find the ….? • What part of the graph tells you what the point means?
Insufficient or too much information • Given a problem, participants will discuss how they can help students determine if all the information is given; and what is missing. • Participants create a list of questions that a student may use to help determine if any information is missing.