Download
1 / 20
220 likes | 504 Views
Mapping of soil moisture content by SWAT and GIS programming. Yuri Kim Jessica Jahnke GEOG 593. Watershed.py. Preparing SWAT input files. Preparing GIS Data Raster dataset DEM LULC Feature dataset Soil Stream Outlet. Watershed Delineation (with DEM and outlet point).

E N D
Mapping of soil moisture content by SWAT and GIS programming Yuri Kim Jessica Jahnke GEOG 593
Watershed.py Preparing SWAT input files • Preparing • GIS Data • Raster dataset • DEM • LULC • Feature dataset • Soil • Stream • Outlet Watershed Delineation (with DEM and outlet point) Feature2raster.py SWAT simulation Watershed SWAT output text file HRU mp (Hydrologic Response Unit) Overlay Soil Convert text file to dbf Join Lulc SWAT output text file Soil Moisture Map reclLULC.py txt2dbf.py Hrumap.py ? ExtracbyMask.py Procedure List_env.py
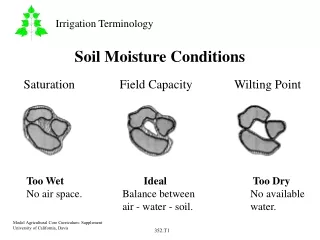
Environment setting (List_evn.py) • Setting up working environment for all GIS data management process • Standardized cell size, output extent, output coordination, ect. DEM raster • Check out ‘Spatial Analysis extention’
Watershed delineation (Watershed.py) 1. Fill • Creating a depressionless DEM • Input: DEM (dem_10mspm) • Output: filled DEM (fill_rd) • All subsequent process will be done with this filled DEM
Watershed delineation, cont. (Watershed.py) 2. Flow direction • Input: Filled DEM • Output: fld_rd • Direction of flow is known for each cell by this process
Watershed delineation, cont. (Watershed.py) 3. Flow accumulation • Input: Flow direction grid • Output: flcc_rd • Each cell has value which represents the number of cells upstream form that cell.
Watershed delineation, cont. (Watershed.py) 4. Watershed outlet point • Input: stream gague point shape file • Output: point grid • Convert point shapfile to grid • This new rater cells overlap with the high-flow pathway of flow accumulation raster; if not, the watershed that is created from this point will be too small.
Watershed delineation, cont. (Watershed.py) 5. Watershed delineation • Input: flow direction raster, outlet point raster • Output: Watershed grid • This raster zone represents the area upstream from the selected outlet point
Clip (ExtracbyMask.py) • Convert soil feature layer to raster dataset (feature2raster.py) • Reclassify LULC raster dataset by SWAT category (reclLulc.py) • Clip lulc and soil dataset with watershed boundary
Hydrologic Response Units (HRU) • Hydrologic response units are lumped land areas within the subbasin that are comprised of unique land cover, soil and management combinations
Making HRU map • To create a unique number which represents the watershed, soil type and LULC of an area, those three layers were overlaid using the following weights: 10000000 x watershed + 10000 x soil + LULC • This analysis results in an 8 digit number : the first digit represents the watershed, the second, third, and fourth digits represent the soil type, the fifth digit is always zero and the sixth, seventh and eighth digit represent the land cover type
Making HRU Map (continued) Example: _ _ _ _ _ _ _ _ 1 1 1 2 0 1 1 0 Watershed Soil Type LULC
Convert text file to dbf file (txt2dbf.py) • Making dbf file from SWAT result file (.sbs) • Example
Making soil moisture map • Joining hru_lookup table (from SWAT) to the HRU map • Joining SWAT result dbf file to the HRU map • Display classified soil moisture map
Result – Soil Moisture map • Simulation period: 06/14/2000 – 06/22/2000 • Dry period (before rainfall): 7 days Fast response area Slow response area
is the final soil water content (mm H2O), is the initial soil water content on day i (mm H2O), is the amount of precipitation on day i (mm H2O), is the amount of surface runoff on day i (mm H2O), is the amount of evapotranspiration on day i (mm H2O), is the amount of water entering ground water zone from the soil profile on day i (mm H2O), and is the amount of return flow on day i (mm H2O). Discussion – Soil moisture balance eq. Depend on the LULC and Soil characteristics.
Discussion – Landuse/Landcover • Agriculture - Fast response area - Shallow soil depth - Contribute to fast runoff - Sediment and nutrient problem • Forest - Slow response area - Deeper soil than any other area
Discussion – Soil characteristics • SSURGO soil data - Natural Resources Conservation Service (NCGC) archived and distributed SSURGO soil data from 1995 - 2003 • Soil characteristic - Soil Hydrologic Group (A, B, C and D) - Maximum rooting depth - Saturated hydraulic conductivity - Avaliable water capacity - etc.
Further Study • GIS Programming problems 1. Joining problem - Impossible with python - With VBA (Spatial Join) 2. Classification problem (in display) - With VBA (ClassBreakRenderer) • SWAT modeling problem 1. Need more calibration to improve model accuracy