Download

1 / 18
190 likes | 558 Views
Volatility Surface 1.Implied Volatility 2.Volatility Smile 3.Term Structure of Volatility 4.Implied Volatility Surface 5.Case Analysis Wenqing Huang Zhiwen Zhang Yiqing Wang.

E N D
Volatility Surface • 1.Implied Volatility • 2.Volatility Smile • 3.Term Structure of Volatility • 4.Implied Volatility Surface • 5.Case Analysis Wenqing Huang Zhiwen Zhang Yiqing Wang
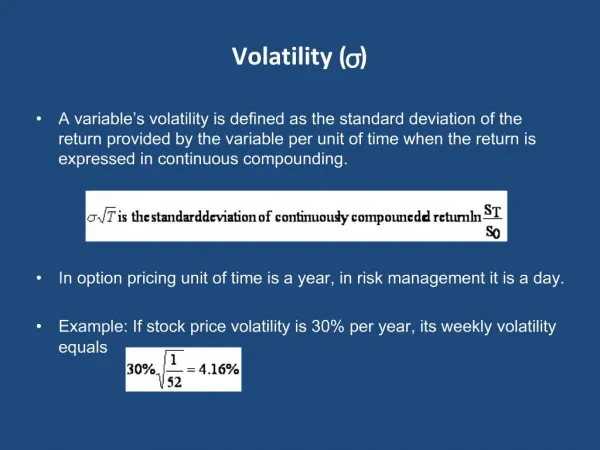
Volatility is a measure for variation of price of a financial instrument over time. Historical volatility is a direct measure of the movement of the underlying price (realized volatility) over recent history (e.g. a trailing 21-day period).An implied volatility is derived from the market price of a market traded derivative (in particular an option)
For instance, the IBM call option, struck at $100 and expiring in 6 months, may have an implied volatility of 18%, • While the put option struck at $105 and expiring in 1 month may have an implied volatility of 21%. • At the same time, the historical volatility for IBM for the previous 21 day period might be 17% (all volatilities are expressed in annualized percentage moves).
Implied volatilities often exceed their historic counterparts prior to a major announcement (such as an earnings announcement or a merger), and tend to the mean afterwards. • For example, if the market is enthusiastic about a specific stock (perhaps due to a great earnings report), then a call option will be expensive. Accordingly, a covered call is a good strategy.
Implied volatility as measure of relative value EX: A call option is trading at $1.50 with the underlying trading at $42.05. The implied volatility of the option is determined to be 18.0%. A short time later, the option is trading at $2.10 with the underlying at $43.34, yielding an implied volatility of 17.2%.
Implied Volatility Surface A three-dimensional curved surface. Delta as a function of M and DTM. Z-axis(Delta),X-axis(DTM),Y-axis(M).
LSM under implied Volatility σ(T, X ) =c0+c1T+c2T2 +c3T3+c4 X+c5X2+ c6 X3+c7TX+c8T2X +c9TX2. (findck) A 3rd degree polynomial surface with 10 unknowns so we need 10 data points. LSM provides a best approximation to the coefficient mathematically.
Linear system of Equation under LSM A.c = z A is the DTM &M coefficient matrix. c is the unknown coefficient matrix which is to be calculated later on. z is the calculated implied volatilities matrix which will be introduced with their access from the collected data in the following discussion.
Case Analysis 1.Data Collection. 2. Calculation of implied volatility(bid,ask,mid) using black-scholes online calculator. 3. A , c , z matrices. 4.
A=[1,0.0082,0.0082^2,0.0082^3,0.958908,0.958908^2,0.958908^3,0.0082*0.958908,0.0082^2*0.958908,0.0082*0.958908^2;A=[1,0.0082,0.0082^2,0.0082^3,0.958908,0.958908^2,0.958908^3,0.0082*0.958908,0.0082^2*0.958908,0.0082*0.958908^2; 1,0.0082,0.0082^2,0.0082^3,0.97771,0.97771^2,0.97771^3,0.0082*0.97771,0.0082*0.0082*0.97771,0.0082*0.97771^2; 1,0.0082,0.0082^2,0.0082^3,0.987111,0.987111^2,0.987111^3,0.0082*0.987111,0.0082*0.0082*0.987111,0.0082*0.987111^2; 1,0.0082,0.0082^2,0.0082^3,0.996512,0.996512^2,0.996512^3,0.0082*0.996512,0.0082*0.0082*0.996512,0.0082*0.996512^2; 1,0.0082,0.0082^2,0.0082^3,1.005913,1.005913^2,1.005913^3,0.0082*1.005913,0.0082*0.0082*1.005913,0.0082*1.005913^2; 1,0.0082,0.0082^2,0.0082^3,1.015314,1.015314^2,1.015314^3,0.0082*1.015314,0.0082*0.0082*1.015314,0.0082*1.015314^2; 1,0.0082,0.0082^2,0.0082^3,1.024715,1.024715^2,1.024715^3,0.0082*1.024715,0.0082*0.0082*1.024715,0.0082*1.024715^2; 1,0.0082,0.0082^2,0.0082^3,1.034116,1.034116^2,1.034116^3,0.0082*1.034116,0.0082*0.0082*1.034116,0.0082*1.034116^2; 1,0.0082,0.0082^2,0.0082^3,1.052919,1.052919^2,1.052919^3,0.0082*1.052919,0.0082*0.0082*1.052919,0.0082*1.052919^2; 1,0.0849,0.0849^2,0.0849^3,1.090523,1.090523^2,1.090523^3,0.0849*1.090523,0.0849*0.0849*1.090523,0.0849*1.090523^2;]; Z=[0.1379;0.23095;0.2193;0.2013;0.1968;0.1948;0.1961;0.2057;0.2358;0.14445];