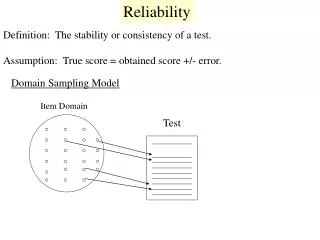
Reliability Strategy
Reliability Strategy. Service Impact on Reliability … Getting Reliability to the “Next Level”. Shlomo Eisenbach. Philips Healthcare, CT/NM BU. CT Reliability. Philips Healthcare, Imaging Systems Reliability Values Reliability Strategies Service Strategy impact on Reliability.


Reliability Strategy
E N D
Presentation Transcript
ReliabilityStrategy Service Impact on Reliability … Getting Reliability to the “Next Level” Shlomo Eisenbach Philips Healthcare, CT/NM BU
CT Reliability • Philips Healthcare, Imaging Systems • Reliability Values • Reliability Strategies • Service Strategy impact on Reliability
Depth and reach of Philips HealthcareWhat we do. Where we are.
What is a CT System? • Rotation speed: 300 RPM • Rotor ~1250 Kg (more than 40 g in fast rotation) • Tube consuming 120 kW • Ultra fast frame rates: 10,000 samples per second • 100,000 detectors in a system • Temperature stabilization: +/- .25 degrees • Electronic noise: 1-2 pA • Mechanical tolerance should be below : 20 microns • Reconstruction speed: 40 images per second • Reliability / uptime • Number of images per scan: more then 2000 X-Ray Detectors reading the amount of X-ray absorbed by the patient. Computers will process this data. An X-Ray tube rotating around the patient and irradiating the patient
Why Reliability is Mission Critical in Healthcare Imaging Systems? 35
Customer Value Business Value • Reduce warranty cost • Reduce remediation investment • Service business profitability • Increase Repeating sales • Improve Brand reliability reputation • Increase Market share • Maximize product availability • Improve reliability perception • Minimal impact of Customer Life Cycle Cost Reliability Values
Customer Reliability Perception Perception based on:
Reliability StrategiesChange the Rules for sustainable impact • Identify Customer/s • Close the Loop (Gates and feedback) • Service Policies Impact on Reliability • Practical Approaches
Identify Customers and stakeholders • Call Rate reduction BU Customer Support • Cost saving • Reduce Total Repair Time • Planed FRU usage • Global Sales & Service • Customer Satisfaction • Reduce Unplanned Down time • End Customer
Gates & Feedback Cycles Failure Rate Tracking & Gating Spec Design Integration Verification Validation Process Design Assembly Final Test Call Rate Tracking & Analysis Installation Service Event ? Suppliers Strategy should start with Gates (customers impact) and short fix cycles
Customer Focus Gates ? Reliability Perception Reliability Perception Reliability Measurement Reliability Measurement APAC EMEA NA APAC NA EMEA Last release (v1.2) measured to be less reliablethan previous Customer informal feedback reliability was improved relative to previous version. .
Service Policies Impact on Reliability • Basic Service Strategies • 2 ways Prediction • Service Policies and Impact on Reliability • Preventive Maintenance • Specific example
Reliability Prediction Based on field DataAvoid long and costly ALTs POWER BRUSH BLOCK Beta = 0.95 Eta = 2650h • Predicting Reliability out of Failure Rate is a challenge. • Need full statistical data e.g. -FRU (Field Replaceable Unit) failure age and suspended age)
Reliability Prediction Forward From Internal Lab Tests to System Failure Rate Prediction • Install Base Traditional Call Rate measurement is per Calendar. • It blends the different ages and tend to be stable with seasonal fluctuations. • Replacement Rate by ageis the relevant metric for reliability view. • Can be predicted out of early reliability measurements. • The Renewal Density function is the theory behind Call Rate by Age • FRU = Field replaceable Unit (usually non repairable) • Reliability [R] = Survival of Non Repairable items • Call Rate [CR] = Known Customer Issues
Service Policy impact Reliability Example Proactive Replacement Shlomo Eisenbach Philips Healthcare
Project: Proactive HW Replacement Goal: No unplanned HW parts replacement Prevent unplanned Corrective Maintenance visits and improve Uptime • Customer Satisfaction • Reduce Scanner Down time • Call Rate reduction • (> X Call/sys/year) • Cost saving • (> X M€/ year) • Reduce Total Repair Time • Planed FRU usage “50,000 miles” checkups & treatment Reactive: Replace by failure Proactive: Replace by “Mileage”
Example: BR64 FansReplacing failed fan: As it happened Replacements after failure (CM) Feb-05 • 6 Fans were replaced at 3 CM visits • 3 X Down time events • 3 X Customer Calls • 26 CM Hours • Total cost = 2,700€ Corrective Maintenance Planed Preventive Maintenance 23
Example: BR64 Fans:ApplyingProactive replacement @ age of 1.5 years Replace after failure (CM) Feb-05 3 Proactive replacements (in 5 years = every 18 month) • 7 Fans would be replaced,at 3 PM visits and 1 CM event • 1 X Down time events (Vs. 3) • 1 X Customer Calls (Vs. 3) • 6 CM Hrs + 3 PM Hrs (vs. 26) • Total cost = 1,400€ (Vs. 2,700€) Corrective Maintenance Planed Preventive Maintenance
Selecting age to Replace FRU The following graph show call rate saving and € saving versus FRU age if replaced by age. • Replacing too soon will cost a lot due too excessive replacement • Replacing too late will give the same results as with no aged replacement • PM policy of 18 month will: • Reduce calls from 0.54 to 0.22 call/sys/year. • Reduce system cost from 540€ to 371€
Preventive Maintenance Policy Vision: Any CT product will have less than 6 Unplanned Corrective Maintenance events within 5 years after release Preventive Maintenance (Inspection & Cleaning) Proactive Replacement (Aged FRUs) Maintenance. Timing by: 1 Maintenance by calendar age Replacement by calendar age Current Project Current policy Age 2 2 Maintenance by usage Replacement by usage Future Plans Future Plans Usage