Risk Management Strategies for Trading Desks
Learn about pricing modes, VaR implementation, server-side mechanics, performance measurement, and more for effective risk management in trading desks.

Risk Management Strategies for Trading Desks
E N D
Presentation Transcript
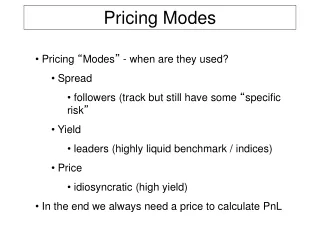
Pricing Modes • Pricing “Modes” - when are they used? • Spread • followers (track but still have some “specific risk” • Yield • leaders (highly liquid benchmark / indices) • Price • idiosyncratic (high yield) • In the end we always need a price to calculate PnL
Bucketing by Maturity • Create 4 sub-books by “remaining term” • 0-2 years • 0 < remaining_term <= 2 • 2-5 years • 2 < remaining_term <= 5 • 5-10 years • 5 < remaining_term <= 10 • 10-30+ years • 10 < remaining_term • Easy way to chop up your risk by the parameter that drives rate sensitivity the most (time left to maturity) • Calculate remaining_term on everything in the tradingbook.txt then put in 1 of the 4 buckets • Either create 4 sub collections or scan once and maintain structure per bucket
Basic VaR Categories • Historical Simulation • “Full re-val” or “Greeks based” • Simple, explainable, repeatable • Supplement with stress testing • Need lots of historical data • Can proxy to indicies and do a specific risk add-on” • Variance/co-variance • Correlations maintained in a matrix • Unlike historical which captures correlations by default (just add PnL vectors) • Example FX and IR • Simulation on normal distribution function • Random draw against a probability density function
Basic VaR categories cont… • Historical Simulation • Full re-val • better for “path dependent” products and capturing non-linear behavior • “Greeks based” (simpler to implement and less computation) • Supplement with stress testing • Hypothetical (the black swan) • Actual past extreme event “greatest hits” • Depends on history and how far you look-back is… • Depends on availability of clean historical data (no holes) • Per security • Per benchmark • Can add on a “index tracking error” or “specific risk”
VaR Implementation • Historical simulation • Parameterize by “holding period” and “confidence interval” • e.g, 1 day, 99% confidence interval • At least 10 days of historical data (in practice min of 3 years) • Each security will have an associated historical file • Name will be the unique ID in our data file for ex., “SBB_0001.txt” • Each historical file will have either: • YIELD • SPREAD • PRICE • Column based like our other data files • Pricing modes won’t be mixed (all YIELD or all SPREAD, etc.) • Refer to Spreadsheet example
VaR Implementation cont… • 1 data file per security ex: “SBB_0001.txt” • At least 10 days of data • There will be an historical file for each benchmark security T2, T5, T10, T30 • For spread priced you will have to look up benchmark yield for that day • New SBB_io_class.h/.cc • Date ValType ValValue DV01 Benchmark • ValType can be either “YIELD”, “SPREAD”, “PRICE” • Benchmark will be string equal to ticker in our yieldcurve.txt file e.g, “T2” • Calculate a PnL vector for each security • Total VaR for book is derived by: • adding the individual security vectors • calculating using confidence interval “90%” • Var will have to be “attributed” (is the PnL due to credit spread or interest rate?) • Benchmark yield movement (yields in our treasury.txt) • Credit spread movement (for bonds that are priced by SPREAD) • Historical files will have spread of yield per day • For each day we’ll have to calculate price then calculation price changes between days • Our PnL vector is percentage changes of price between days • Refer to spreadsheet
Enhancements to server-side • Pricing “Modes” • spread, yield, price - when are they used? • VaR of the book • Expected (from history) vs Potential (from stress testing) • Time “holding period” will always be 1 day • In practice this could be be 5 or 10 days. • Parameterize by confidence interval (could be either 99% or 95%) • How did VaR change with book composition and/or market data? • PnL “Attribution” - • interest Rate (IR01) • credit spread (CS01) • Segregate or calculate by quality types • Above/below Investment grade • By quality code
Server-side Mechanics • Test all of your server capabilities with simple Python driver • Server-side API is determined by how you craft your message set • Message set choices • ASCII or Binary - go ASCII so you can debug • Balancing process hop frequency vs. server-side grouping of results • Client/Server concerns • Recovery - what happens when your server crashes? • Sync or async - start async and you can always go sync • Sharing data between compute processes • Sourcing data inside the compute grid • Case study - Govt bond trading desk pricing/risk app
Performance Measurement • Now that we have a server… • Parameterize start_clock(…) and end_clock(…) which are called from START_TIMER()/END_TIMER()New SBB_util.h/cc will be posted • Return real, user, system measures via message to client • Also measure net time spent in the client process • Net sojourn time + client overhead for each user operation • Display real, user, system on the GUI at bottom of screen • Example (see spreadsheet V2 mockup)