Download
1 / 19
190 likes | 213 Views
Detailed analysis of RAD applications and awards as of 12/31/13, including regional breakdowns, PH unit percentages, top applicants, project locations, financing types, and program objectives.

E N D
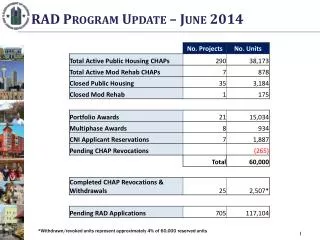
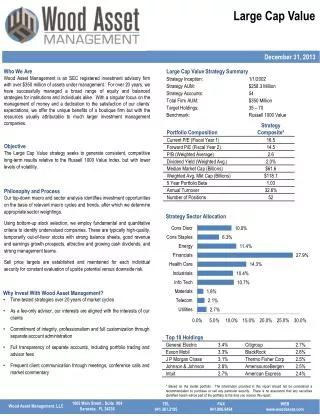
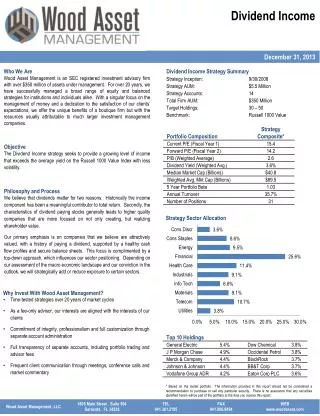
RAD Program Update December 31, 2013
Apps, CHAPs & Closings Note: This data reflects applications received as of 12/31/13 and CHAPs awarded through 1/6/14. CHAP Awardees includes CNI applicants as well as Portfolio and Multiphase awards made as of 1/6/14.
Percentage of Public Housing Applications by Census Region Compared to Current Pubic Housing Projects RAD:16% PH: 29% RAD: 11% PH: 8% RAD: 17% PH: 13% RAD: 56% PH: 49% Note: This data reflects the regional breakdown of RAD applications (“projects”) received compared to the number of existing PH projects in each region.
Percentage of Current PH Units by HUD Region that have Applied for RAD 15% 6% 7% 3% 7% 18% 16% 21% 22% 21% Note: This data reflects the percentage of PH units in each HUD region that have applied for RAD; note that units are considered public housing until the RAD closing is complete.
RAD Participant Profile Top 10 Applicants by PHA • Chicago, IL – 10,935 units • El Paso, TX – 6,100 units • Nashville, TN - 5,384 units • Birmingham, AL - 5,015 units • Baltimore, MD – 4,583 units • San Francisco, CA – 4,575 units • Charlotte, NC - 3,424 units • Mobile, AL – 3,410 units • Tampa, FL – 3,065 units • Greensboro, NC – 2,195 units
Size of PHA Note: This data reflects the percentage of unique PHAs that have applied for RAD, by size.
Type Of Permanent Project Financing Type of 1st Mortgage Financing (without Tax Credits)
Type Of Permanent Project Financing Type of 1st Mortgage Financing (with Tax Credits)
Addressing Range of Challenges Indicated PHA Objectives • Modernize aging family & elderly properties • Sub rehab of deteriorated properties • Thin densities/mix-incomes via PBVs & transfer authority • Demolish/replace severely distressed/obsolete properties • Portfolio streamlining
2nd Component Update Current Status
2nd Component of RAD Update • Remaining Rent Supp and RAP Stock by FY Expiration Total RAP Units: 11,088 Total RS Units: 5,053