Download

1 / 16
160 likes | 174 Views
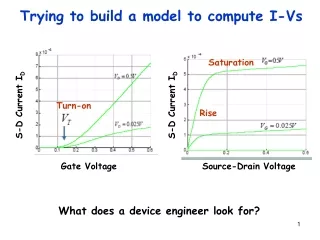
Understand the systematic errors in medium-range forecasts of GFS model leading to water vapor loss and reduced precipitation over the tropical west Pacific. Analyze the impact of synoptic-scale circulation errors on track forecasts, TC development, and convection patterns. Investigate connections between physical parameterizations, circulation features, and water vapor behavior in the tropics. Examine the episodic nature of water vapor loss during quiet regimes and its implications. Evaluate the role of surface fluxes in forecast destabilization. Improve GFS predictions through enhanced understanding of these dynamics.

E N D
Trying to Stop a Leak in the Operational Global Model Thomas J. Galarneau, Jr. Mesoscale Dynamics Section Mesoscale and Microscale Meteorology Laboratory National Center for Atmospheric Research NCAR Day of Networking and Discovery 17 April 2015
Conclusions • NCEP Global Forecast System (GFS) model loses atmospheric water vapor over tropical west Pacific during “quiet” regimes • Reduced precipitation/synoptic-scale outflow • Difficulty in predicting TC development • Behavior of physical parameterizations is important for medium-range forecasts
Initial Motivation to Examine GFS GFS North Atlantic Track Error Statistics 2012–2014 • Significant degradation of medium-range GFS track forecasts relative to the HFIP “baseline” • Track errors motivate examination of synoptic-scale flow in GFS forecasts • Are there systematic medium-range forecast errors in synoptic-scale circulation features? • Are there linkages between forecast errors in circulation features and the behavior of convection and water vapor in the tropics? GFS mean absolute track error HFIP “baseline” track error
Synoptic-Scale Flow Errors (2014) • Synoptic-scale eddies too weak in GFS forecasts • Difficult to maintain amplified (or, blocked) flow 168-h GFS Forecast Error: 500 hPaψ and ψ error Composite Mean 8 Jul–7 Nov 2014 anticyclonic cyclonic ×106 m2 s−1
Composite mean 8 July–7 Nov 2014 250 hPa wind speed (blue contours in m/s), 250 hPaVdiv(arrows in m/s), and 600–400 hPa mean vertical velocity (shaded in Pa/s) GFS Analysis • Decrease in tropical convection over western and central Pacific • Reduced divergent outflow from tropics toward NH midlatitude jet/waveguide • Reduced divergent outflow from NH tropics toward SH 168-h GFS Forecast descent ascent Pa s−1 = WPAC region
Composite mean 8 July–7 Nov 2014 Precipitable water (PW) error (shaded in mm) Forecast minus analysis 24-h GFS Forecast • GFS loses water vapor over tropical west Pacific warm pool • PW also decreases over parts of eastern Pacific and southeast Atlantic 168-h GFS Forecast too moist too dry mm = WPAC region
2014 GFS Precipitable Water: WPAC • PW loss is episodic • Prevalent during “quiet” regimes = Active Tropical Cyclone May 26 June 5 June 15 June 25 July 5 July 15 July 25 Fengshen precursor TC Fengshen July 13 July 23 Aug 2 Aug 12 Aug 22 Sep 1 Sep 11
GFS Misses Development of Fengshen 250 hPa Height (black contours in dam), 700 hPa wind (arrows > 5 m/s), and PW (shaded in mm) Initialized 00Z/27 Aug bad forecast GFS forecast fails to develop Fengshen disturbance as PW dramatically decreases
GFS Recovers SLP (black contours in hPa), 10-m wind (arrows > 5 m/s), and wind speed (shaded in m/s) Initialized 00Z/3 Sep good forecast Later GFS forecast improves when Fengshen disturbance is initialized
2014 GFS Precipitable Water: WPAC • PW loss is episodic • Prevalent during “quiet” regimes = Active Tropical Cyclone May 26 June 5 June 15 June 25 July 5 July 15 July 25 Fengshen precursor TC Fengshen July 13 July 23 Aug 2 Aug 12 Aug 22 Sep 1 Sep 11
2014 GFS Precipitable Water: EPAC and NATL Eastern Pacific North Atlantic May 27 June 6 June 16 June 26 July 6 July 16 July 26 • PW forecasts are much better in other basins
2014 GFS Relative Humidity: WPAC 14-Aug 24-Aug 3-Sep 13-Sep “quiet” regime Fig. 4a in Holloway and Neelin (2009, JAS) 15-Jul 25-Jul 4-Aug
Precipitation • GFS appears to produce too much precipitation everywhere in 0–24 h forecast • Precipitation gradually decreases with increasing forecast lead during quiet regime • Reduction of precipitation is consistent with static stabilization Quiet regime
Precipitation and Vertical Velocity “Quiet” Regime* over tropical west Pacific Vertical Velocity (cm/s) Precipitation (mm) Total rain Cumulus rain CMORPH Height (km) • GFS produces too much cumulus precipitation in 0–24 h forecast and gradually decreases thereafter • Cumulus scheme driving too much deep convection early in forecast? ascent *quiet regime: 1 Aug–5 Sep and 10–31 Oct 2014 (n=58)
GFS TvProfile and LHFX: WPAC “Quiet” Regime* Virtual Temperature Bias (K) Surface Latent Heat Flux (W m−2) • too much heating aloft early in forecast • column stabilizes through 96-h • deep cold bias by 120–168-h (as convection weakens?) Height (km) • Reduced surface fluxes may contribute to inability to offset deep layer stabilization • Lower fluxes linked to low wind speed bias of 0.5–1 m/s at surface (0.5 m/s ≈ 10 W m−2) warm bias cold bias *quiet regime: 1 Aug–5 Sep and 10–31 Oct 2014 (n=58)
Summary • GFS model loses atmospheric water vapor over tropical west Pacific during “quiet” regimes • Reduces precipitation • Hinders TC development • Atmosphere overturns early in forecast (0–24 h) and does not recover • Cumulus scheme too active early • Surface fluxes too low to aid in destabilization • Behavior of physical parameterizations is important for medium-range forecasts