ENSO Background
Learn about El Niño and La Niña phenomena that influence global weather patterns. Dive into ENSO cycles, SOI data, and climatic impacts to predict seasonal outcomes. Discover how these oceanic events impact snowfall in Baltimore and Philadelphia.

ENSO Background
E N D
Presentation Transcript
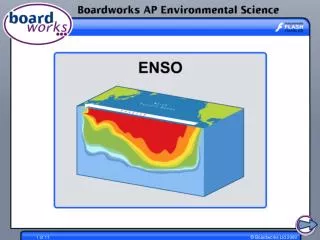
ENSO Background "El-Niño" is named after a Peruvian Christmas festival where the warming of the waters off Peru is said to occur near the birthday of "The Boy" (El Niño), or the Christ child. Meteorologists thus named the phenomenon the "El-Niño Southern Oscillation", or ENSO for short. The reverse phenomenon, the cooling of the eastern Pacific waters, was at first called "Anti-El-Niño", until it was realised that this literally meant the Anti-Christ ! To avoid this unfortunate connotation, it was renamed "La-Niña" (or "The Girl").
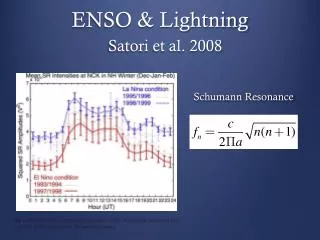
ENSO and SOI Current SOI Data (CPC) • The El-Niño Southern Oscillation is the result of a cyclic warming and cooling of the surface ocean of the central and eastern Pacific. This region of the ocean is normally colder than it's equatorial location would suggest, mainly due to the influence of northeasterly trade winds, a cold ocean current flowing up the coast of Chile, and to the upwelling of cold deep water off the coast of Peru. • At times, the influence of these cold water sources wane, causing the surface of the eastern and central Pacific to warm up under the tropical sun - this is an EL-NIÑO event. This results in heavy rainfall in South America, but severe droughts in eastern Australia. The more intense the El-Niño, the Great ENSO and Southern Oscillation Site
ENSO and SOI • It has been found that the cyclic warming and cooling of the eastern and central Pacific leaves it's distinctive fingerprint on sea level pressure. In particular, when the pressure measured at Darwin is compared with that measured at Tahiti, the difference between the two can be used to generate an "index" number. When there is a positive number, we have a La-Niña (or ocean cooling), but when the number is negative we have an El-Niño (or ocean warming). Great ENSO and Southern Oscillation Site
The 2006 El Nino “It is important to keep in mind 2 salient points regarding this El Niño event. First we have never seen a El Niño event develop in the month of August. Not once as it ever happened. Second ...last winter...2005-06 featured a weak La Nina event. If you take a look at the history of the El Niño events in the Winter which have occurred after a weak La Nina the previous Winter we find a very significant fact in the database.Which is this... Most of the El Nino events that have occurred after a WEAK La Nina the previous Winter has NOT reached Moderate El Nino criteria for more a than a few weeks. (DT)
La Nina in 2007 –SSC- Pacific Pattern ConclusionBased on everything mentioned, I give the following odds for a DJF ENSO event per my index:- 15% of a Weak La Nina (-0.5c to -0.9c)- 70% chance of Moderate La Nina (-1.0c to -1.5c) - 15% chance of Strong La Nina (below -1.6c)There is a good chance that the La Nina will sustain itself, or weaken at a very slow rate throughout the Winter. Based on this, here is my predicted range for the months of Nov - Feb. - November: -1.0c to -1.4c- December: -1.1c to -1.5c- January: -1.1c to -1.5c- February: -0.9c to -1.3cA Winter time Moderate La Nina favors persistent ridging south of the Aleutian islands, with a trough in the Gulf of Alaska and sometimes Alaska. The downstream effect of this pattern over the USA is for above average temperatures and below average precipitation over the South, and Eastern US. Below average temperatures and above average precipitation is favored over the Upper Midwest and Northwest, US. The Pacific signal expected is almost as bad as it gets for the East.
Local Climatology and ENSO El Nino good, La Nina bad for the Mid Atlantic. Baltimore average seasonal total overall=20.58"ENSO Neutral average=24.29"El Nino years average=22.84"weak Nino average=21.56"mod Nino average=28.06"strong Nino=19.98"La Nina years average=17.0"weak Nina average=22.5"mod Nina average=11.74"strong Nina average=13.15The data suggests that an El Nino on average is favorable for slightly above average snow for Baltimore, with a moderate El Nino the jackpot!!! La Nina on average favors significantly less than average snow for Baltimore! The most unfavorable ENSO condition for snow in Baltimore appears to be a moderate La Nina.
ENSO and Philadelphia Snowfall Climatology On average, weak El Nino winters rank #1 when it comes to Philadelphia having its snowiest winters relative to average (average = 19.3 inches). However, seasonal totals may vary greatly among weak El Nino winters. Moderate El Nino winters also favor seasonal snowfall totals that are above average. Strong El Nino winters strongly favor below normal seasonal snowfall totals as do Strong La Nina winters. Of the 14 El Nino winters that were either weak or moderate: • 9 had above normal snowfall • 5 had below normal snowfall • average snowfall + 23.4 inches • snowiest winter = 2002-03 (46.3 inches) • least snowiest = 1918-19 (4.5 inches) Note: Baltimore, Maryland experiences its largest average seasonal snowfall total during moderate El Nino winters. Moderate El Nino winters favor much above normal snowfall to our south and southwest.
El Nino and Local Climatology • El Nino’s tend to favor colder than normal February. • Large scale snowstorms are more likely in El Nino years. • Weak El Nino’s tend to be colder than moderate El Nino’s along the Eastern seaboard.
Importance of ENSO “Although there is little doubt that the El Nino events are somewhat is over hyped... the fact of the matter is that El Nino and La Nina events are major players and MUST be considered in any attempt to make a seasonal forecast. The technical name for the El Nino and La Nina event is ENSO. The warm water events popularly called El Nino can also be referred to as warm ENSO while the cold water events La Nina is referred to as cold ENSO events.” (DT)
Weak Versus Moderate/Strong El Nino Events These next four images will clearly show differing impacts between a weak El Niño and a moderate or strong one with respect to temperatures and precipitation. As you can clearly see there is a very strong correlation between a weak El Niño event and colder than normal temperatures over much of the central and especially eastern US. Taking a look at the precipitation patterns we see that in the period of OCT- NOV- DEC there is a strong bias of Much Below Normal rainfall over the lower Plains during the weak El Niño event that is not their during a moderate or strong El Niño. Not surprisingly the drought they have been having over the lower Plains strongly matches the warm El Niño scenario with regard to rainfall. DT
Weak Versus Moderate/Strong El Nino Events You see, in a strong El Nino year, so much warm air keeps getting pumped northeastward that the jet never has the chance top come down over the smaller continent of North America. The air only marginally cold over North America on its own; it must be seeded and grow colder on its way into cause the severe cold weather we see sometimes. In the strong El Nino seasons, the southern jet is so pronounced is pumps warm air all the way through North America and it keep the jet tight, the vortex feeding back so when it does come south it often does with limited quick shots and its main residue is over Greenland and Iceland.
ENSO and Temperature and Precipitation Patterns U.S. Climate Data: Put December 2006 Precipitation Map Here for true el Nino conditions.
El Nino • El Nino Link Strong Subtropical Jet Stream
El Nino 500mb Heights/ Anomalies for December 23, 2006. Note: The entire 2nd half of December was much above normal temperature wise for Philadelphia. There was also no reported snow in PHL or NYC during this time frame. In fact, NYC had a snow-less December in 2006.
El Nino Data Click here for current El Nino Data Previous ENSO Years (1951 to present) 57-58: Nino maxed out at +1.6 making it a MODERATE/STRONG Nino 58-59: 63-64: (Weakened quickly by February) 65-66: Nino maxed out at +1.6 making it a MODERATE/STRONG Nino 69-70: 72-73: Nino maxed out at +2.1 making it a STRONG Nino and the 3rd biggest on record 76-77: 77-78: (MODERATE EL NINO) 79-80: 82-83: Nino maxed out at +2.3 making it a STRONG Nino and the 2nd biggest on record 86-87: Nino maxed out at +1.6 making it a STRONG Nino 1987-88: (MODERATE EL NINO). Weakened rapidly in Feb/Mar) 1991-92: STONG Nino from Jan through March 92-93: MODERATE EL NINO 1994-95: (MODERATE EL NINO) 97-98: Nino maxed out at +2.5 making it a STRONG Nino and the largest on record 02-03: Nino maxed out at +1.5 making it a MODERATE Nino 2004-05 1925-26: ? 26-27: ? 39-40: ? 40-41: ? 51-52: NEUTRAL/ WEAK 53-54: NEUTRAL WEAK
JB on El Nino, SOI, Ridging, Jet Streams, and Storms (Jan 2007) “In fact if one researches the el nino winters, many of the storms one sees are with active branches of the southern jet and un-phased with the northern branch, though one or two "blockbusters" ( blizzard of 1958, March 1958, blizzard of 1966, twins, Ohio valley and New England of 1978) do love to show up in weakening el nino's. Major warmth that has been beaten back close by, cross polar flow and here comes the southern jet with the negative SOI pulse of the MJO. What happens in such cases is a battle that leads to plenty of snow and ice nationwide with southern stream storms, and at first no big wind up storms, but as the pattern matures, that is when you have to worry about the extreme. The big key here is the visible fall of the height field east of the date line over the coming weeks, and the development of a ridge northeast of the Caspian and the major Alaskan ridge,. Those two ridges can lock hands over the top, and force the low height field to develop with cross polar flow coming into it, from Hudson bay to the gulf.” JB post in January 2007
More JB on Weakening El Nino’s and Cold Outbreaks “I am more convinced than ever about what we are facing here as far as cold goes and feel that the period Feb 1-15 has a good chance to be a top 10- to 15-day period of ANY 15 DAY PERIOD of cold for the nation as a whole. Yes, this is a step even deeper into the freezer, but there is almost unanimous model consensus on a pattern that fits very closely with previous severe cold outbreaks in weakening El Nino seasons. Certainly, the ensembles have not thrown any cold water on this, and operational runs of all the models I have seen say the same thing, that the cold is expanding with time and that what we are seeing now is not as cold as what is coming.” - JB on January 19, 2007-
Transition into El Nino (Summer 2006 into Winter 2006) and Forecasting the Trend During the Winter The turning of the SOI (Southern Oscillation Index) to a prolonged negative phase beginning in May and continuing through to the present also sounded alarm bells, that a warm phase of the ENSO, or an El Nino was coming. The MEI (Multivariate ENSO Index) began to rise in mid-Spring and has continued since, exceeding the El Nino MEI threshold (>= 0.5) in July and recorded a value of 0.892 as of September. By mid-August equatorial SST anomalies had risen above 0.5 degrees C in all 4 ENSO regions in the equatorial Pacific indicating that in deed we have transitioned into an El Nino this Fall.
Transition into El Nino (Summer 2006 into Winter 2006) and Forecasting the Trend During the Winter A key assumption a seasonal forecaster must make this winter is if this current warm phase is going to be a weak, moderate, or strong episode. My arbitrary definition is a DJF (December-February) MEI average value of 0.5 to 1.0 for weak, 1.0 to 1.5 for moderate, and > 1.5 strong. This is of course arbitrary and may or may not be true but is what I will use for my evaluation. In looking at computer model forecasts of ENSO, the behavior of the SOI, equatorial Pacific sub-surface temperatures, and my own reasoning, I believe that this ENSO warm episode will peak in the moderate classification I have designated above, probably somewhere between 1.0 and 1.25 from an MEI perspective, and that the meteorological winter (DJF) 06-07 MEI average value will be somewhere in that range. So what this all means is that I favor an ENSO state that is in the moderate category. (Raleigh Wx)
The 2006 El Nino “It is important to keep in mind 2 salient points regarding this El Niño event. First we have never seen a El Niño event develop in the month of August. Not once as it ever happened. Second ...last winter...2005-06 featured a weak La Nina event. If you take a look at the history of the El Niño events in the Winter which have occurred after a weak La Nina the previous Winter we find a very significant fact in the database.Which is this... Most of the El Nino events that have occurred after a WEAK La Nina the previous Winter has NOT reached Moderate El Nino criteria for more a than a few weeks. (DT)
DT on El Nino and QBO (January 2007) • The QBO dropped DRAMATICALLY in DEC to well under +10 to a value of +6.10... this combined with a weakening El Nino (+0.9) during the week of January 1, 2006 tells me the 2nd of the winter will be impressively cold and stormy for much of the US as it has been warm and dry. The combination of weakening moderate El Nino and near neutral QBO winters are a LOCK -- as much as one can have such thing in seasonal forecasting for a Good if not GREAT 2nd half of winter and a delayed spring. (DT)
El Nino and Temperature Anomalies (DT) Weak El Nino’s Moderate El Nino’s Strong El Nino’s
El Nino Data (October 2006) Note the trend of a strengthening El Nino to Moderate/Strong values with a gradual weakening after reaching a peak in DEC06/JAN07. • Nino3.4 SST Anomalies • ENSO Model Forecasts • ENSO Model Forecasts
El Nino Data (January 2007) Note the trend of a weakening El Nino
El Nino (Digging a Little Deeper) Seasonal Snowfall Estimates for 2006-2007 “Based on snowfall tendencies during weak to moderate El Niño events coupled with a warm anomaly in ENSO Region 1+2, odds favor lesser snowfall amounts in some of the cities that have fared very well in recent years in the northern Mid-Atlantic region. Eastern New England seems poised for average to above average snowfall.” Don S. TAKE NOTE: Thus it is important to note the exact nature of the El Nino relative to the specific regions of the Pacific Ocean. (HURM)
The Peaking of El Nino “In terms of years that saw a weak to moderate El Niño peak no later than November-December-January, the East tended to be cool while the central and southern Plains tended to be warm.” Don S.
El Nino Trends (November 2006) Climatology says that a +1.5 peak suggests that the tri-monthly El Nino will most likely max out in the +1.4 to +1.8 range, with a 3 month average El Nino max being in the +1.3 to +1.5 range. The recent trends alone suggest that we have a near 100% chance of seeing a Mod-Nino for DJF, and there is now an increasing chance that we could actually see a Strong Nino peak sometime in the DJF time frame. Chance of a Mod-Nino dominated winter: 80%Chance of a Strong-Nino dominated winter: 20% -SSC(2006)- Note: Philadelphia climatology varies greatly between moderate El Nino winters and strong El Nino winters, as it does for the weak and moderate El Nino comparison. How strong this El Nino becomes is KEY to our overall winter temperatures and snowfall. Hurm (2006)
El Nino and MJO Watch out during phase 7 and 8 of the MJO. The “Pineapple Express” and the “Southern Jet Impulse(s)” can BOTH play into a major east coast snowstorm.
El Nino and PDO Typically weak to moderate El Nino events support a positive Pacific Decadal Oscillation (PDO) and thus a ridge in the west and a trough in the east with cooler than average temperatures especially in January/February) and more precipitation/snow than normal with an active subtropical jet. In addition to the Equatorial Pacific, the North Pacific has an effect on our weather. Currently there is an expanding cool pool of water in the Gulf of Alaska. The water profile can change very quickly, but if this cool pool should grow stronger, this suggests that when the North Atlantic Oscillation (NAO, see discussion below) is positive that warmer air would be able to make it into our region more easily as the amplitude of the ridge/trough axis would be flatter. (Capital Weather 2006-07 forecast)
EPO and El Nino During El Nino's, the effects of the EPO are little to none. This is shown in great lengths by winters 91-92 and 94-95. During these winters, the EPO was severely negative, but the Pacific flow across the northern US and Canada was too powerful to allow for the EPO to have any impact. The El Nino acts as a block in that regard. Because of this, I can say with high confidence that the EPO will be a non-factor this winter. Since it will have little to no impact, it isn't worth predicting for, although an El Nino does favor a -EPO. (Posted by met on easternuswx.com for winter of 2006-07))
El Nino and Computer Forecasting Models (Winter of 2006-07) • Many of the weather models beyond Day 5 or 6 will be depicting a biased to the WARM side throughout most of this winter. This warm bias will exist because many of the weather models are going to be over depicting the troughs coming in from the eastern Pacific into the Western portions of North America. And if the model over does the deep trough on the West Coast... the Ridge over the central and eastern US will of course also be overdoneThis will be especially true when we have a -NAO in place. This is a very common model characteristic of weak and moderate El Niño winters.... and it is imperative that weather forecasters keep this in mind. As a result we will see a consistent tendency of the warm air to be over forecasted at Day 7 or let's say Day10 only to see each subsequent model run showing the warm air backing off a little more. DT