Download
1 / 45
450 likes | 986 Views
Some Concepts * Estimators : Random variables used to estimate population parameters. Example : p hat is an estimator of p * Estimates: Specific values of an estimator. Example :. * Point Estimates : Specify a single value of a population parameter.

E N D
Some Concepts *Estimators: Random variables used to estimate population parameters. Example: p hat is an estimator of p *Estimates:Specific values of an estimator. Example:
*Point Estimates: Specify a single value of a population parameter. Example: =120 *Confidence Interval/Interval Estimates: Calculates 2 numbers based on sample that form an interval within which the parameter is expected to lie. Example: 115< <125 is an interval estimate of mean
What Estimators Should We Use? • There are many different ways to summarize the information you get from a sample. • Median • Average of smallest and largest What properties would we like our estimator to have?
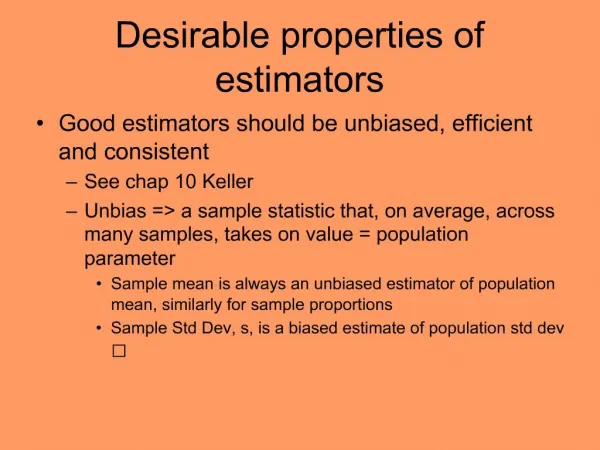
Desirable Properties of Estimators: 1.Unbiasedness: An estimator is said to be unbiased if the expected value of the estimator is equal to true value of the parameter being estimated, or Example: sample proportion is the unbiased estimator of population proportion 2. Efficiency: The most efficient estimator among a group of unbiased estimators is the one with the smallest variance.
Example: Three different estimators based on sample size n f is the density function of the estimator Estimator 1 and 2 are unbiased and 3 is biased. Variance of 1 greater than 2 and 2 greater than 3. But estimator 3 is biased, so in this group, estimator 2 is most efficient.
Large-sample estimation of a population mean *sampling distribution of mean will be approximately normal regardless of the probability distribution of the sampled population when n is large. (central limit theorem) *the mean of sampling distribution of will always equal . Thus is an unbiased estimator of (does this mean that every observed sample mean will equal the population mean?) *basically the expected value of the sample mean is the population mean *the standard deviation of the sampling distribution of is
*Point estimate of a population mean *Interval Estimator of population mean: We have (1- ) 100% confidence that the interval contains the population mean: Where, is the z value corresponding to an area in the upper tail of a standard normal distribution. n=sample size = standard deviation of the sampled population
*But how can we get the population standard deviation? Usually, is unknown. It can be approximated by the sample standard deviation s when the sample size is large. *How large is large? n>=30
Example: a sample with n=50, =8.1and s=0.24 • Point estimate of population mean • Interval estimate of population mean with a 95% confidence level • Interval estimate of population mean with a 90% confidence level.
The interval estimate so far is two-sided interval estimate. Some times we need one-side interval estimate: *Lower one-sided confidence interval (LCL) LCL= (point estimate)- *(standard error of estimator) *Upper one-sided confidence interval(UCL) UCL= (point estimate)+ *(standard error of estimator) Where standard error of estimator =
Example: a sample with n=50, =8.1 and s=0.24 4) LCL estimate of population mean 5) UCL estimate of population mean
When sample is large (n is large), we can use sample standard deviation s as reliable estimator of population standard deviation And no matter what distribution the population has, sampling distribution of sample mean is normally distributed But, what if sample is small?
Consequences of small sample size: • if population does not possess normal distribution, sampling distribution of small sample mean is not normal distribution. • is much more variable than • (It has thicker tails) • What should we do to deal with those problems?
Assumption: 1) population is normally distributed 2) sample is small and is unknown If we use sample standard deviation s to replace The statistic t follows one mound-shaped distribution, which is called t-distribution. Where s is sample standard deviation
Property of t-distribution 1) t-distribution is mound-shaped 2) t-distribution is perfectly symmetric about t=0 3) t-distribution is more variable than z (normal distribution is also called z-distribution) 4) t-distribution is affected by the sample size n
Because when n changes, s changes, t-distribution is affected by sample size n. Therefore, different sample sizes have different t- distributions, even if sample is picked form the same population. We call number n-1 the number of degree of freedom (d.f.) associated with s2 and thus the t-statistic. Example: when n=10, d.f.=10-1=9 So, before we check the t-distribution, we need to first determine degree of freedom.
How to check the t-distribution table • tα records the value of t such that an area α lies to its right. (Appendix II, Table 4, pp611) • Determine the degree of freedom • Determine what value α is (usually a is given in the question) • Find the tα
Problems: • n=10, find t0.05 and t0.025 • n 30, find t0.05 and t0.025 • Repeat 1 with n=9 • Do you remember we said when n>30, we may think it is a large sample? After doing these problems, did you get the intuition about why we set 30 as the dividing line?
Remember the t-distribution based on the assumption that the sampled population possesses a normal probability distribution. This is very restricted assumption. Fortunately, it can be shown that distribution of the t statistic possesses nearly the same shape as the theoretical t-distribution for population that are nonnormal but possesses a mound-shaped probability distribution. So even population is not normal but mount-shaped, we can use t-distribution. In our class, except for when specifically stated, we will suppose using t-distribution is proper.
Small-sample (1- )100% confidence interval estimator of the mean is Where, s is sample standard deviation and t has (n-1) d.f. is the estimated standard deviation of
Problem: here is a sample of diamonds weights: {0.46, 0.61, 0.52, 0.48, 0.57, 0.54} Find the 95% confidence interval estimate for population mean.
Estimating the difference between two means Properties of the sampling distribution of ( ), the difference two sample means: When independent random samples of n1 and n2 observations have been selected from population with means and and variances and respectively, the sampling distribution of the difference will have the following properties: 1) The mean and standard deviation of ( ) will be and
2) If the sampled populations are normally distributed, then the sampling distribution of ( ) is exactly normally distributed, regardless of the sample size. 3) If the sample populations are not normally distributed, then the sampling distribution of ( ) is approximately normally distributed when n1 and n2 are large, due to the Central Limit Theorem.
Point Estimation of ( ) Large Sample A (1- ) 100% confidence interval for ( ) If population variance are unknown, they can be approximated by the sample variances.
Example: n1=30 n2=30, sample mean are 1.32 and 1.04 respectively, sample variance are 0.9734 and 0.7291 respectively. • Point estimate of difference of mean • 90% confidence interval estimate of difference of mean
In small sample Assumption 1: both samples are picked from population with normal distribution. Assumption 2: both population possess equal variances. Then t statistic follows t-distribution Where s is sample standard deviation Degrees of freedom = n1+n2-2
Both assumptions are very restrictive Assumption 1: As before, even if the population has a non-normal distribution, but have a mound-shaped distribution, a t-statistic found will be very close to the theoretical t-statistic. Assumption 2: Usually we don’t know population distribution. In our class, we just can suppose they are same when we have such questions As to the question which s to use, we pool the information from two samples and get the so-called “pooled estimator of population variance”
Estimating the Difference Between Two Mean: Small Sample If the two samples are small (<30) Point estimate of the difference:
A (1- )100% small-sample confidence interval for ( ) Where s is obtained from the pooled estimate, given before.
Example: here are two samples {32, 37, 35, 28, 41, 44, 35, 31, 34} {35, 31, 29, 25, 34, 40, 27, 32, 31} What is 95% confidence interval estimate of difference between two sample means?
Properties of sampling distribution of the sample proportion • If a random sample of n observations is selected from a binomial population with parameter p, the sampling distribution of the sample proportion • will have a mean • and a standard deviation: • where q=1-p • 2. when the sample size n is large, the sampling distribution of sample proportion will be approximately normal. Remember the rule is np and nq both greater than or equals to 5
Estimating a Binomial proportion Point estimator: The sample proportion is an unbiased estimator of population proportion, so *Point estimator of p: *Interval estimator depend on what sampling distribution of sample proportion is
So, If • we use sample proportion as reliable estimate of population proportion p, and • 2) n* and n*(1- ) both greater than 5, then • A (1- )100% confidence interval for p is
Example: n=100, x=59 1) What is the point estimate of p? 2) What is 95% confidence interval of the estimate for p?
Estimating the Difference Between Two Binomial Proportions • Point estimate • Confidence interval for the difference
Example • A recent survey of girls between 9 and 14 years old showed that 44% of the white girls surveyed and 28% of the African-American girls reported that they had tried to lose weight. Assume 100 girls of each ethnicity were surveyed. • What is the estimated difference in population proportions. • Construct a 99% confidence interval of the difference in proportions.
Choosing sample size Questions to ask before determining optimal n: 1) What level of confidence do you want to have (i.e., the value of 100(1- )? 2) What is the maximum difference (D) you want to permit between the estimate of the population parameter and the true population parameter.
Procedure • Once you have chosen D and alpha solve the following equation for sample size n: So this can be used for any of the estimators that we have talked about thus far, you just need the proper standard error
Additional info • When you are using two different samples calculate just one n and use it for both • Choosing the proper standard deviation and proportion can be hard, use any information from past experiments you may have • When using proportions choosing a p of .5 will give you the largest possible n value you may want to use it to be safe
Additional info continued • If you are concerned with the n to choose when using means and you have some idea of what the range (R ) is you can estimate the standard deviation as
Example: we know the population standard deviation is 0.24 and we want the error of the estimation to be less than 0.06 with 95% confidence. At least how many observations do we need in the sample?