Piers Corbyn
Is it The Sun - Or is it You?
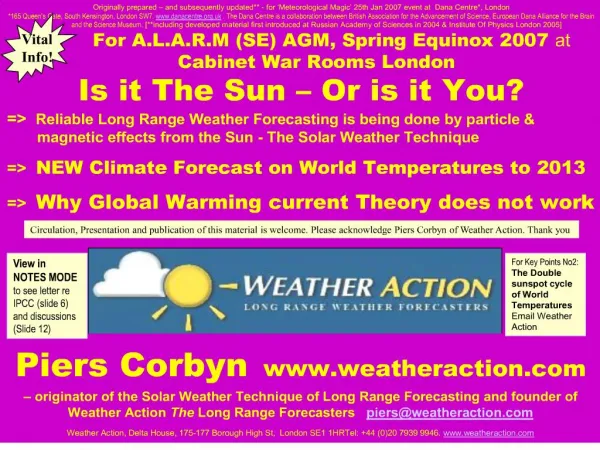

Piers Corbyn
E N D
Presentation Transcript
2. The Solar Weather Technique is a new paradigm!The Solar Weather Technique is a new paradigm!
3. The Solar Weather Technique is a new paradigm!The Solar Weather Technique is a new paradigm!
4. The Solar Weather Technique is a new paradigm!The Solar Weather Technique is a new paradigm!
9. Weather Action The Long Range Forecasters
Delta House, 175-177 Borough High Street, London SE1 1HR, Tel +44(0)20 7939 9946 Fax +44(0)20 7939 9948 E: info@weatheraction.com
�
11th Feb 2007 URGENT � By post also by email / fax.
�
To: Rt Hon David Miliband MP, Secretary Of State for Environment Food & Rural Affairs:
DEFRA, Nobel House, 17 Smith Sq, London SW1P 3JR (Email secretaryofstate@defra.gsi.gov.uk)
�
and Sir David King, Chief Scientific Adviser to Her Majesty�s Government: DTI, 1 Victoria Street, London SW1H OET. (Email: mpst.king@dti.gsi.gov.uk )
�
Copy to the President of the Royal Society: Professor Martin Rees, Lord Rees of Ludlow Kt PRS:
The Royal Society, 6-9 Carlton House Terrace, SW1Y 5AG. (RS fax: +44 (0)20 7930 2170)
�
Dear David and Sir David,
Serious omission in Final Draft IPCC Summary For Policy Makers, (�The Physical Science Basis�). Action needed prior to IPCC 26th session, Bangkok 4th May 2007.
I understand from the public circulation of the IPCC letters to governments that the Final draft Summary For Policy Makers (Physical Science basis � Working Group 1) released on Feb 2nd will be subject to final acceptance at the IPCC session in Bangkok on 4th May.
I have read the Draft Summary for Policy Makers and note a serious omission which if not corrected would justify �sceptics�* such as myself in believing that some sort of cover-up is afoot and I therefore urge you request that the IPCC correct it. (* �sceptic� of CO2 as a key driver of temperature rise / Climate Change, not of Climate Change itself which has been going on for millions of years)
The request concerns Figure SPM-1 (page 3 of 18 in a recent copy) which shows the continuous rise of concentration over the last 4,000 years of all of three greenhouse gases considered there � mainly CO2 but also methane and nitrous oxide. Please ask � indeed insist - that the IPCC also show - on the same set of graphs - World and/or Arctic similarly smoothed temperature estimates over the period from at least the �Climate Optimum� about 4,000 years ago to recent times.
It is beyond belief that a report can be published in the name of science which claims that CO2 rising levels cause rising temperatures while only reporting the presumed cause without the supposed historical consequences � ie temperature changes - which are also well documented in data in possession of the IPCC, such as from the internationally funded Arctic Climate Impact Assessment (ACIA) project.
There are other points I and others take issue with, such as serious misrepresentation of solar activity in the Report, but the omission above is so important I thought it should be drawn to your personal attentions. Please correct it for the good of science and public knowledge.
One other matters which causes great confusion in the public mind is the continuous reference in the media to this and other IPCC reports as being �by/from 2,500 (leading) scientists� when in fact the report is drafted and finalized by appointees of Governments who may have little or no expertise in many of the wide ranging fields covered. It should further be noted that the many scientists who undertake diligent measurement and observational or estimation work which is used to indirectly support the report conclusions have generally no expertise or locus around the key subject on which the findings of the report are actually based, namely �Climate Models�. This is the preserve of only a handful of people who generally are in government funded institutions rather than more independent bodies. Perhaps the phrase �The (IPCC) Report by appointees of many governments� would be fairer and should be insisted on, and would not incorrectly imply informed confirmed agreement from many scientists whose work, however excellent, does no such thing.
Thank you
Piers Corbyn, ARCS FRAS FRMetS, Mobile 07958713320Weather Action The Long Range Forecasters
Delta House, 175-177 Borough High Street, London SE1 1HR, Tel +44(0)20 7939 9946 Fax +44(0)20 7939 9948 E: info@weatheraction.com
�
11th Feb 2007 URGENT � By post also by email / fax.
�
To: Rt Hon David Miliband MP, Secretary Of State for Environment Food & Rural Affairs:
DEFRA, Nobel House, 17 Smith Sq, London SW1P 3JR (Email secretaryofstate@defra.gsi.gov.uk)
�
and Sir David King, Chief Scientific Adviser to Her Majesty�s Government: DTI, 1 Victoria Street, London SW1H OET. (Email: mpst.king@dti.gsi.gov.uk )
�
Copy to the President of the Royal Society: Professor Martin Rees, Lord Rees of Ludlow Kt PRS:
The Royal Society, 6-9 Carlton House Terrace, SW1Y 5AG. (RS fax: +44 (0)20 7930 2170)
�
Dear David and Sir David,
Serious omission in Final Draft IPCC Summary For Policy Makers, (�The Physical Science Basis�). Action needed prior to IPCC 26th session, Bangkok 4th May 2007.
I understand from the public circulation of the IPCC letters to governments that the Final draft Summary For Policy Makers (Physical Science basis � Working Group 1) released on Feb 2nd will be subject to final acceptance at the IPCC session in Bangkok on 4th May.
I have read the Draft Summary for Policy Makers and note a serious omission which if not corrected would justify �sceptics�* such as myself in believing that some sort of cover-up is afoot and I therefore urge you request that the IPCC correct it. (* �sceptic� of CO2 as a key driver of temperature rise / Climate Change, not of Climate Change itself which has been going on for millions of years)
The request concerns Figure SPM-1 (page 3 of 18 in a recent copy) which shows the continuous rise of concentration over the last 4,000 years of all of three greenhouse gases considered there � mainly CO2 but also methane and nitrous oxide. Please ask � indeed insist - that the IPCC also show - on the same set of graphs - World and/or Arctic similarly smoothed temperature estimates over the period from at least the �Climate Optimum� about 4,000 years ago to recent times.
It is beyond belief that a report can be published in the name of science which claims that CO2 rising levels cause rising temperatures while only reporting the presumed cause without the supposed historical consequences � ie temperature changes - which are also well documented in data in possession of the IPCC, such as from the internationally funded Arctic Climate Impact Assessment (ACIA) project.
There are other points I and others take issue with, such as serious misrepresentation of solar activity in the Report, but the omission above is so important I thought it should be drawn to your personal attentions. Please correct it for the good of science and public knowledge.
One other matters which causes great confusion in the public mind is the continuous reference in the media to this and other IPCC reports as being �by/from 2,500 (leading) scientists� when in fact the report is drafted and finalized by appointees of Governments who may have little or no expertise in many of the wide ranging fields covered. It should further be noted that the many scientists who undertake diligent measurement and observational or estimation work which is used to indirectly support the report conclusions have generally no expertise or locus around the key subject on which the findings of the report are actually based, namely �Climate Models�. This is the preserve of only a handful of people who generally are in government funded institutions rather than more independent bodies. Perhaps the phrase �The (IPCC) Report by appointees of many governments� would be fairer and should be insisted on, and would not incorrectly imply informed confirmed agreement from many scientists whose work, however excellent, does no such thing.
Thank you
Piers Corbyn, ARCS FRAS FRMetS, Mobile 07958713320
15. Graphs of ANNUAL measures of Particles from the Sun (aa index), World temperatures (GLT anom), and CO2 levels.
(note the colour of the graphs changes in next slides)
SOLAR PARTCLES � mainly protons and electrons � are ejected by the Sun all the time in what is called the SOLAR WIND. They disturb the earth�s magnetic field and this effect is measured by the �aa� index.
THE GLT ANOMOLY is the deviation of world temperature (deg C) from a long term standard.
The Graphs show large changes in temperatures and particles especially over decades yet relatively only very slow changes of CO2 levels.Graphs of ANNUAL measures of Particles from the Sun (aa index), World temperatures (GLT anom), and CO2 levels.
(note the colour of the graphs changes in next slides)
SOLAR PARTCLES � mainly protons and electrons � are ejected by the Sun all the time in what is called the SOLAR WIND. They disturb the earth�s magnetic field and this effect is measured by the �aa� index.
THE GLT ANOMOLY is the deviation of world temperature (deg C) from a long term standard.
The Graphs show large changes in temperatures and particles especially over decades yet relatively only very slow changes of CO2 levels.
16. These Graphs represents CYCLES OF VARIATION.
A peak means there is a lot of variation in the data with the period labeled.
For example if the data were average monthly temperatures in your home town then there would be a lot of annual variation � period 1year.
The graphs show the main periodic cycles in:
Geomagnetic activity � which measures particles hitting the Earth�s magnetic field. The largest variation is that of the sunspot cycle � about 10.7 years period in the 130 years of data examined.
World Temperatures. The main variation is about 21.3 years period in this data - which is twice the particle variation period.
The Sun�s magnetic field changes every sunspot cycle to make an approx 22yr cycle of magnetic linkage � and hence particle penetration into the Earth�s polar regions and atmosphere. World temperatures follow the particles and so they show the same cycle of variation. THERE IS NO OTHER EXPLANATION.
The main cycle of variation of world temperatures is nothing to do with CO2.These Graphs represents CYCLES OF VARIATION.
A peak means there is a lot of variation in the data with the period labeled.
For example if the data were average monthly temperatures in your home town then there would be a lot of annual variation � period 1year.
The graphs show the main periodic cycles in:
Geomagnetic activity � which measures particles hitting the Earth�s magnetic field. The largest variation is that of the sunspot cycle � about 10.7 years period in the 130 years of data examined.
World Temperatures. The main variation is about 21.3 years period in this data - which is twice the particle variation period.
The Sun�s magnetic field changes every sunspot cycle to make an approx 22yr cycle of magnetic linkage � and hence particle penetration into the Earth�s polar regions and atmosphere. World temperatures follow the particles and so they show the same cycle of variation. THERE IS NO OTHER EXPLANATION.
The main cycle of variation of world temperatures is nothing to do with CO2.
17. Graphs of World temps (red) and particle effects (blue) averaged over successive solar cycles (on average about 11 years duration)
The smoothed temperatures follow particles quite well but tend to move up and down at alternate cycles.
A single solar cycle ~11yr temperature affect was put forward by N D Marsh and H Svensmark. 2000 �Low cloud properties influenced by Cosmic Rays� Phys Rev letters Vol 85 5004-5007. They used inverse solar cycle length (since more intense cycles are shorter) as a measure of Solar activity and propose the mechanism that increased solar activity leads to less extra-solar system cosmic rays reaching Earth and so less cloud cover and on average higher World Temperatures. [Ref also Jaworowski, Zbigniew, 2003. <http://www.21stcenturysciencetech.com/Articles%202004/Winter2003-4/global_warming.pdf>].Graphs of World temps (red) and particle effects (blue) averaged over successive solar cycles (on average about 11 years duration)
The smoothed temperatures follow particles quite well but tend to move up and down at alternate cycles.
A single solar cycle ~11yr temperature affect was put forward by N D Marsh and H Svensmark. 2000 �Low cloud properties influenced by Cosmic Rays� Phys Rev letters Vol 85 5004-5007. They used inverse solar cycle length (since more intense cycles are shorter) as a measure of Solar activity and propose the mechanism that increased solar activity leads to less extra-solar system cosmic rays reaching Earth and so less cloud cover and on average higher World Temperatures. [Ref also Jaworowski, Zbigniew, 2003. <http://www.21stcenturysciencetech.com/Articles%202004/Winter2003-4/global_warming.pdf>].
18. Graphs of World temps (red) and particle effects (blue) averaged over successive DOUBLE solar cycles (on average about 22 years duration)
The temperatures and particles show excellent correlation over the double sunspot cycle.
The reason for the excellent correlation is that the Sun�s magnetic field changes direction at each 11 year cycle making a 22 year cycle of Sun-Earth magnetic linkage (the �Hale� cycle). This 22yr cycle correlation is an advance on single solar cycle studies.
Can anyone objectively and scientifically argue that CO2 levels are more effective than solar particles in controlling world temperatures?
Remember! If that were true CO2 levels including man-made activity would also have to control particles from the sun. That would be somewhat ludicrous!Graphs of World temps (red) and particle effects (blue) averaged over successive DOUBLE solar cycles (on average about 22 years duration)
The temperatures and particles show excellent correlation over the double sunspot cycle.
The reason for the excellent correlation is that the Sun�s magnetic field changes direction at each 11 year cycle making a 22 year cycle of Sun-Earth magnetic linkage (the �Hale� cycle). This 22yr cycle correlation is an advance on single solar cycle studies.
Can anyone objectively and scientifically argue that CO2 levels are more effective than solar particles in controlling world temperatures?
Remember! If that were true CO2 levels including man-made activity would also have to control particles from the sun. That would be somewhat ludicrous!
19. The graphs show generally
World Temperatures and Particle effect (as measured by geomagnetic activity) move together very closely when averaged over the natural magnetic cycles of Sun-Earth interaction � the Hale cycles of about 22 yrs.
Carbon Dioxide is just generally increasing and is NOT so closely correlated with temperatures.
THE ONLY logical conclusion is that world Temperatures are decisively influenced by particles from the Sun.
If CO2 and some modification by volcanoes and dust are manipulated to change in the same way as temperatures it might be argued that this combination actually controls temperatures. However how could it be that Earth�s temperature or a concocted CO2/volcano combination controls particle flow from the Sun?! Of course it cannot be so.
CO2 is not in control. It is an effect not a cause!
NEVERTHELESS over the last Hale period something strange has happened � particles have gone down while temperature has gone up.
This coincides with (1) the widely claimed �solar undimming� (ie reduction of atmospheric smoke/dust because of Clean air Acts. This could explain it all but we think this effect has been exaggerated).
(2) More significantly this Temperature-Geomagnetic Gap (�TG Gap�) coincides with rapid motion of the magnetic North pole towards the Geographic pole. The Earth warmed rapidly at about the same rate when a similar Trans-Polar shift took place 1,000 years ago.The graphs show generally
World Temperatures and Particle effect (as measured by geomagnetic activity) move together very closely when averaged over the natural magnetic cycles of Sun-Earth interaction � the Hale cycles of about 22 yrs.
Carbon Dioxide is just generally increasing and is NOT so closely correlated with temperatures.
THE ONLY logical conclusion is that world Temperatures are decisively influenced by particles from the Sun.
If CO2 and some modification by volcanoes and dust are manipulated to change in the same way as temperatures it might be argued that this combination actually controls temperatures. However how could it be that Earth�s temperature or a concocted CO2/volcano combination controls particle flow from the Sun?! Of course it cannot be so.
CO2 is not in control. It is an effect not a cause!
NEVERTHELESS over the last Hale period something strange has happened � particles have gone down while temperature has gone up.
This coincides with (1) the widely claimed �solar undimming� (ie reduction of atmospheric smoke/dust because of Clean air Acts. This could explain it all but we think this effect has been exaggerated).
(2) More significantly this Temperature-Geomagnetic Gap (�TG Gap�) coincides with rapid motion of the magnetic North pole towards the Geographic pole. The Earth warmed rapidly at about the same rate when a similar Trans-Polar shift took place 1,000 years ago.
21. The graphs show generally
World Temperatures and Particle effect (as measured by geomagnetic activity) move together very closely when averaged over the natural magnetic cycles of Sun-Earth interaction � the Hale cycles of about 22 yrs.
Carbon Dioxide is just generally increasing and is NOT so closely correlated with temperatures.
THE ONLY logical conclusion is that world Temperatures are decisively influenced by particles from the Sun.
If CO2 and some modification by volcanoes and dust are manipulated to change in the same way as temperatures it might be argued that this combination actually controls temperatures. However how could it be that Earth�s temperature or a concocted CO2/volcano combination controls particle flow from the Sun?! Of course it cannot be so.
CO2 is not in control. It is an effect not a cause!
NEVERTHELESS over the last Hale period something strange has happened � particles have gone down while temperature has gone up.
This coincides with (1) the widely claimed �solar undimming� (ie reduction of atmospheric smoke/dust because of Clean air Acts. This could explain it all but we think this effect has been exaggerated).
(2) More significantly this Temperature-Geomagnetic Gap (�TG Gap�) coincides with rapid motion of the magnetic North pole towards the Geographic pole. The Earth warmed rapidly at about the same rate when a similar Trans-Polar shift took place 1,000 years ago.The graphs show generally
World Temperatures and Particle effect (as measured by geomagnetic activity) move together very closely when averaged over the natural magnetic cycles of Sun-Earth interaction � the Hale cycles of about 22 yrs.
Carbon Dioxide is just generally increasing and is NOT so closely correlated with temperatures.
THE ONLY logical conclusion is that world Temperatures are decisively influenced by particles from the Sun.
If CO2 and some modification by volcanoes and dust are manipulated to change in the same way as temperatures it might be argued that this combination actually controls temperatures. However how could it be that Earth�s temperature or a concocted CO2/volcano combination controls particle flow from the Sun?! Of course it cannot be so.
CO2 is not in control. It is an effect not a cause!
NEVERTHELESS over the last Hale period something strange has happened � particles have gone down while temperature has gone up.
This coincides with (1) the widely claimed �solar undimming� (ie reduction of atmospheric smoke/dust because of Clean air Acts. This could explain it all but we think this effect has been exaggerated).
(2) More significantly this Temperature-Geomagnetic Gap (�TG Gap�) coincides with rapid motion of the magnetic North pole towards the Geographic pole. The Earth warmed rapidly at about the same rate when a similar Trans-Polar shift took place 1,000 years ago.
24. The effects of Solar activity - (particles, magnetic, X-ray, Ultra violet, Infra Red, Radio, and (indirectly) Cosmic Ray effects � are magnified by Solar Activity magnifying (SAM) processes.
PRIMARY Greenhouse gases - eg Water vapour and Ozone (which are both much more important than C02 as greenhouse gases) are affected by Solar activity. These then affect (sea) surface temperatures.
Particles change the activity of weather fronts (this enables the prediction of major storms), this process changes the efficiency of the Earth�s �weather machine� which pumps heat from equatorial regions towards the poles � and affects average surface temperatures.
Sea surface temperatures control the dynamic rate of CO2 interchange with the oceans (70% of World surface). Warmer oceans give out more CO2 and absorb less.
This is one way in which temperatures � which are essentially on average controlled by solar particles - affect levels of SECONDARY greenhouse gases such as CO2. There are also many other factors such as the amount of ice covering the ocean which may hinder C02 emission and the C02 content of upwelling seawaters (which themselves have been determined by events centuries earlier when they took CO2 out of the atmosphere in downwelling cold water processes).The effects of Solar activity - (particles, magnetic, X-ray, Ultra violet, Infra Red, Radio, and (indirectly) Cosmic Ray effects � are magnified by Solar Activity magnifying (SAM) processes.
PRIMARY Greenhouse gases - eg Water vapour and Ozone (which are both much more important than C02 as greenhouse gases) are affected by Solar activity. These then affect (sea) surface temperatures.
Particles change the activity of weather fronts (this enables the prediction of major storms), this process changes the efficiency of the Earth�s �weather machine� which pumps heat from equatorial regions towards the poles � and affects average surface temperatures.
Sea surface temperatures control the dynamic rate of CO2 interchange with the oceans (70% of World surface). Warmer oceans give out more CO2 and absorb less.
This is one way in which temperatures � which are essentially on average controlled by solar particles - affect levels of SECONDARY greenhouse gases such as CO2. There are also many other factors such as the amount of ice covering the ocean which may hinder C02 emission and the C02 content of upwelling seawaters (which themselves have been determined by events centuries earlier when they took CO2 out of the atmosphere in downwelling cold water processes).
25. Solar Activity and (other) effects are described by Weather Action Indicators. These are �Fast� and �Slow�. The slow ones control some modulation factors.Solar Activity and (other) effects are described by Weather Action Indicators. These are �Fast� and �Slow�. The slow ones control some modulation factors.
27. INDEPENDENT EVALUATION OF SWT FORECASTS (1) INDEPENDENT EVALUATION OF SWT FORECASTS
Solar Weather Technique (SWT) Forecasts far surpass the accuracy of both Seasonal Trend Forecasts and Forward Projection Models by super computers (which have a reliable time horizon of only 3 or 4 days). According to independent assessments Weather Action forecasts have achieved a high degree of accuracy as well as regularly performing better than traditional forecasts for any period beyond 4 days ahead. A Risk Analyst, working for the US Space Agency NASA, calculated the odds against achieving this success by luck to be millions to one.
An independent study of Weather Action gale forecasts for the British Isles, undertaken by Dr. Dennis Wheeler, a climatologist and leading statistician at the University of Sunderland, states that the possibility that the success rate could have arisen by luck is less than 1 in 1000. Dr Wheeler was commissioned to conduct the evaluation of the SWT by a consortium of leading British insurance companies.
The evaluation was initially intended to monitor the accuracy of Extra Long Range Forecasts (1-2 years ahead) but the monitoring included long range forecasts (1-11 months ahead).
Dr Wheeler�s work is the subject of a comprehensive report. In the introduction to his report Dr Wheeler states that, �Since Piers Corbyn first made his forecasts publicly available a body of sound scientific theory now exists to show that the Earth�s medium and long-term climate is subject to the influence of the sun.�
Piers Corbyn placed bets on his weather forecasts with William Hill every month at �fair odds� recommended by the Met Office and made a consistent profit of about 40% of stakes - from 1988 to 2000 when William Hill ended the arrangement.INDEPENDENT EVALUATION OF SWT FORECASTS
Solar Weather Technique (SWT) Forecasts far surpass the accuracy of both Seasonal Trend Forecasts and Forward Projection Models by super computers (which have a reliable time horizon of only 3 or 4 days). According to independent assessments Weather Action forecasts have achieved a high degree of accuracy as well as regularly performing better than traditional forecasts for any period beyond 4 days ahead. A Risk Analyst, working for the US Space Agency NASA, calculated the odds against achieving this success by luck to be millions to one.
An independent study of Weather Action gale forecasts for the British Isles, undertaken by Dr. Dennis Wheeler, a climatologist and leading statistician at the University of Sunderland, states that the possibility that the success rate could have arisen by luck is less than 1 in 1000. Dr Wheeler was commissioned to conduct the evaluation of the SWT by a consortium of leading British insurance companies.
The evaluation was initially intended to monitor the accuracy of Extra Long Range Forecasts (1-2 years ahead) but the monitoring included long range forecasts (1-11 months ahead).
Dr Wheeler�s work is the subject of a comprehensive report. In the introduction to his report Dr Wheeler states that, �Since Piers Corbyn first made his forecasts publicly available a body of sound scientific theory now exists to show that the Earth�s medium and long-term climate is subject to the influence of the sun.�
Piers Corbyn placed bets on his weather forecasts with William Hill every month at �fair odds� recommended by the Met Office and made a consistent profit of about 40% of stakes - from 1988 to 2000 when William Hill ended the arrangement.
30. The Solar Weather Technique is a new paradigm!The Solar Weather Technique is a new paradigm!