Download
1 / 19
190 likes | 404 Views
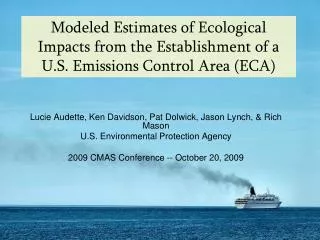
Modeled Estimates of Ecological Impacts from the Establishment of a U.S. Emissions Control Area (ECA). Lucie Audette, Ken Davidson, Pat Dolwick, Jason Lynch, & Rich Mason U.S. Environmental Protection Agency 2009 CMAS Conference -- October 20, 2009. Outline of Presentation.

E N D
Modeled Estimates of Ecological Impacts from the Establishment of a U.S. Emissions Control Area (ECA) Lucie Audette, Ken Davidson, Pat Dolwick, Jason Lynch, & Rich Mason U.S. Environmental Protection Agency 2009 CMAS Conference -- October 20, 2009
Outline of Presentation • Background / Environmental Impacts of Shipping • Air Quality Modeling Configuration • Impacts of ECA on ozone and PM2.5 • Impacts of ECA on visibility • Impacts of ECA on nitrogen and sulfur deposition • Annual deposition levels • Case study over Adirondack Mountains
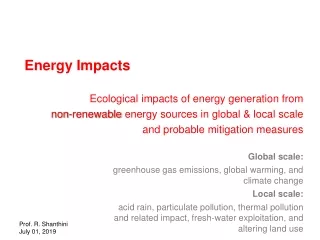
Background information (1) • Shipping-related emissions may cause 60,000 deaths annually • Corbett et al, 2007; Winebrake and Corbett, 2008 • Air pollution from international shipping is difficult to regulate due to jurisdictional issues • Shrader, 2008 • United Nations / International Maritime Organization established MARPOL convention (Annex VI) to prevent air pollution from ships • U.S. promulgated MARPOL Annex IV into law in July 2008 • Maritime Pollution Prevention Act of 2008 • Allows U.S. to apply for ECA designation
Background information (2) • Emissions control areas (ECAs) • stringent fuel sulfur and engine NOx limits for ships operating in a designated ECA. • The U.S., and Canada applied for an ECA designation for specific portions of coastal waters in March 2009. • ECAs need to be approved by IMO member countries • The U.S. / Canadian ECA was approved at the committee level this July • Final vote will be held at March 2010 IMO (MEPC) meeting • All ECA applications need to be accompanied by an analysis showing the environmental impact of shipping emissions • CMAQ modeling analysis was used to look at health and ecological effects of ship emissions and potential in ECA
Air Quality Modeling Configuration • CMAQ v4.6 • 36 & 12km grids, 14 vertical layers • Successful performance evaluation • Modeling Years • 2002 base year • 2020 & 2030 future years • Model Scenarios • Zero out distance modeling • Various ECA permutations • Emissions Inventory • Global Category 3 emissions • Updated port emissions
Impacts of ECA on 8-hour ozone levels • Large improvements in ozone air quality are projected to occur as a result of an ECA designation. • AQ benefit is largest in coastal areas where some locations are projected to average reductions of 0.5 – 2.0 ppb as a result of the tighter ECA NOx standards.
Impacts of ECA on PM2.5 levels • Large improvements in PM2.5 air quality are also projected to occur as a result of an ECA designation. • Again, AQ benefit is largest in coastal areas, exceeding 1.0 ug/m3 annually in many locations • ECA designation is estimated to result in benefits ranging from $27-60 billion dollars (reduced health costs / premature mortality)
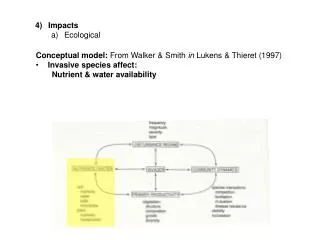
Impacts of ECA on Biomass Loss • Considered ozone impacts on vegetation • Used modeled ozone estimates to calculate W126 ozone metric • Applied to existing concentration/response (C/R) functions, relating response of various tree species to ozone induced biomass loss • Results showed that shipping emissions could be responsible for > 5% of biomass loss in some areas.
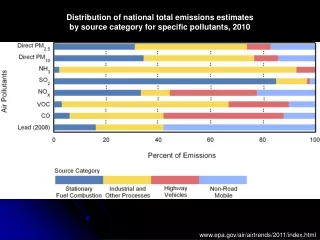
Impacts of ECA Acid Deposition Based on work summarized in the risk and exposure assessment of the secondary SOx/NOx NAAQS there are large parts of the U.S. that are potentially sensitive to acid deposition from atmospheric sources
Impacts of ECA on Acid Deposition • Designation of an ECA will result in a significant reduction in total nitrogen and total sulfur deposition over the U.S. • Reductions of > 10% are projected in most coastal areas by 2020 • Plots below show the change in total N and S deposition in 2020 based on the absolute outputs of the CMAQ model.
Impacts of ECA on Acid Deposition • EPA also developed a post-processing methodology that allows for the model relative response (RRF) to be used in estimating the impacts of a control measure, as is done for O3 and PM2.5 • Utilizes ambient NADP data at the 8-digit HUC level • Combined w/ absolute model predictions of dry deposition changes
Case Study in Adirondacks • The Adirondack Mountains of New York have long been focus areas for acid deposition issues • Poor buffering capability of the soils in this region make the lakes and streams particularly susceptible to soil and surface acidification due to acid deposition • Acidic deposition (CMAQ) and surface water critical load analysis indicated that shipping emissions in 2020 will reduce the number of lakes exceeding their critical load for acidic deposition • 6 fewer lakes (~3%) in the Adirondack Mountains are predicted to receive nitrogen and sulfur deposition loads below the critical load for acidity
Conclusions After extensive sensitivity testing of ECAs of various size, it was determined that a 200 nautical mile zone was the most appropriate While most of the AQ impacts originate from ship emissions that are closest to shore, it was determined that the benefits of the program would outweigh the costs out to at least this distance. Decisions still pending w.r.t. Puerto Rico and the U.S. Virgin Islands.
Conclusions • If adopted by the IMO Annex VI parties, the designation of U.S. coastal waters out to 200 nautical miles as an ECA will have significant benefits for U.S. air quality • Human health impacts / assistance toward NAAQS attainment • Coastal and near-coastal ecosystems • Controls will be phased in between 2011 and 2016. • For more information, please see: • http://www.epa.gov/otaq/oceanvessels.htm
Acknowledgements Computer Science Corporation (CSC) Chris Allen, Allen Beidler, Lucille Bender, Nancy Hwang, Lara Reynolds, Cliff Stanley, and Melanie Wilson EPA Office of Transportation and Air Quality (OTAQ) Penny Carey, Barry Garelick, Jean-Marie Revelt, Mike Samulski, and Molly Zawacki EPA Office of Air Quality Planning and Standards (OAQPS) Tyler Fox, Marc Houyoux, Sharon Phillips, and Norm Possiel California Air Resources Board (CARB) Dongmin Luo