Download
1 / 48
480 likes | 498 Views
This article discusses the importance of wind sensing in Europe for understanding the dynamics of boundary layer storms, fronts, orographic circulations, and other weather phenomena. It explores the current limitations of wind observations and highlights the potential benefits of the ESA Aeolus mission and its prospective follow-ons in providing high-quality wind profiles. The article also introduces the PIEW project, which aims to assess the added value of space-borne Doppler Wind Lidars in enhancing weather prediction systems.

E N D
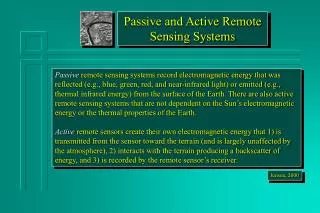
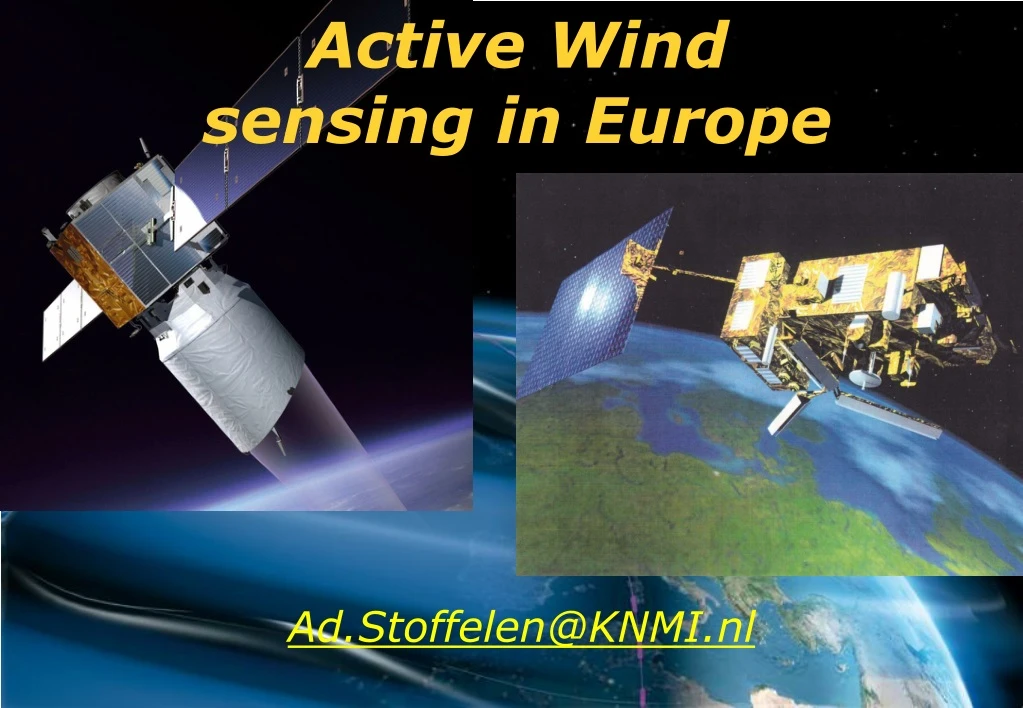
Active Wind sensing in Europe Ad.Stoffelen@KNMI.nl
mature systems developing systems boundary layer storms, fronts orographic circulations planetary waves low pressure systems Wind determines dynamics Bus? Fast Evolution Rossby Radius of deformation for 45 N (or 45 Z) Fog Cloud layer Rain column 10 Z [m] 100 1000 10.000 Slow Mass dominates 10 100 1000 H [km] 10.000 Shower Front Storm Climate zone World
GOS Vertical Resolution lacking • Vertical analysis scale is typically a km in the troposphere • Max. shear is 50 m/s per km at most levels; mean shear is 4 m/s per km • Vertical resolution mainly provided over NH land by radiosondes, profilers and aircraft • High vertical resolution generally not provided by current satellite observations
ESA Aeolus: good quality, modest quantity Wind profiles are the main missing component of the global observing system over ocean, tropics and SH Total number of vertical wind profiles on 25 Sep 2005, 00 UTC: 613 • Aeolus: about 1200 vertical wind profiles per 12 hours; • Similar to radiosonde quality and quantity, but uniform
k -2 Half of wind variance 25% wind variance difference W Logarithm Wind Spectral Density [-] -3 4 times less wind variance kT kRC kG 300 km 10.000100010010 Wave Number [km] Wind Analysis Scales ECMWF model • Wind variance versus scale of collocated KNMI SDP winds and ECMWF FG winds (2001) • Weather models contain little information above sea on scales < 100 km • Lack of upper air measurements • Lack of eddy-scale ocean forcing
Overview • ESA ADM-Aeolus and prospective follow-on • ASCAT scatterometer on MetOp-A • Outlook
ESA Atmospheric Dynamics MissionAeolus& prospective follow-on
3D winds from space • ADM-Aeolus • Post-Aeolus scenario studies • Post-Aeolus DWL recommendation
ADM-Aeolus • Doppler Wind Lidar • Cross-track HLOS winds • sHLOS (z) = 2-3 m/s • Profiles 0–30 km@0.5-2 km • Once every 200 km length • Aerosol and molecular measurement channel • Dawn-dusk polar-orbiter • Launch date June 2009 • www.esa.int/esaLP/LPadmaeolus.html • (Stoffelen et al., BAMS, 2005)
Advanced state of development w.r.t. planned launch date in June 2009 as presented at the ADM workshop, see www.esa.int/esaLP/LPadmaeolus.htm Atmospheric data base including hi-res optical and wind data End-to-end simulator, L1B and L2B wind processor L2A cloud and aerosol processor Ground and air campaign with airborne demonstration Observation operator for NWP data assimilation, information content analysis Assessment of expected impact on numerical analyses for the benefit of NWP and climate studies Beneficial impact of a small sample of measured airborne DWL winds (THORPEX) User community will be ready to use Aeolus wind data Status ADM-Aeolus processing
ECMWF Ensemble Analysis results Profiles of zonal-wind forecast impact (m/s) Ensemble spread used as proxy for analysis and forecast error, and spread reduction as proxy for analysis and forecast impact of the assessed observations • “Direct impact of ADM-Aeolus data on forecast accuracy may be comparable to that of radiosonde data. If promise is realised, what is prospect for early follow-on?”(Simmons, ADM Workshop)
Stare versus Scan DWL OSSE (NCEP) • NH Anomaly Correlation difference with respect to control • GMAO/NCEP • Global Forecast System • T62 • Masutani et al, ADM Workshop • Scan “best” DWL costly • JCSDA: “Significant benefit of wind in NWP is well established … well prepared to use LOS wind data” (LeMarchal, ADM Workshop)
Impact of DLR 2 m Doppler Lidar ECMWF T511, two weeks 3000 observations 0.005% of all observations Better winds than Sonde and AIREP Weissman et al, ADM Workshop First assimilation of real Doppler lidar observations ~3% average 48 - 96 h forecast error reduction over Europe
Reference scenario: ADM-Aeolus 6-hours: about 120 LOS wind observations per hour Observations nearly zonal due to single perspective
Post-Aeolus scenario: Tandem Aeolus + • Same dawn-dusk orbit and instrument, but phase difference 180 degrees (45 minutes) • Minimum of observation coverage redundancy; great heritage (low cost) • Twice as many HLOS profiles as Aeolus 6-hours ofsampling
DWL scenarios: Dual perspective • Two LOS on the same satellite or two satellites in similar orbits • 90 degrees between the pointing directions • Twice as many HLOS profiles as Aeolus 6-hour orbit started at the equator
PIEW Objectives • ESA project PIEW Prediction Improvement of Extreme Weather • Assess the added value of space-borne DWLs in NWP systems to enhance the predictive skill of high-impact weather systems • What DWL coverage and quality is needed to capture rapidly-evolving sensitive structures, which are otherwise not observed? • Capability requirements for ADM follow-on system
Mean DWL analysis impact 500 hPa wind • Aeolus scenario • 38 cases at 12 Z • Covering all seasons • Impact scale in m/s • Positive impact • Gaps betweentracks
Mean DWL analysis impact 500 hPa wind • Dual-perspective better than single LOS (Aeolus), but still gaps between tracks • Tandem-Aeolus scenario has reasonably spatially uniform improvements and is generally more positive than dual perspective Tandem Dual-Persp.
Mean DWL forecast impact • Analysis and forecast impacts are vertically consistent and well distributed • Benefit over multiple cycles larger Aeolus Dual-pers. Tandem Triple
Cycled DWL impact on analyses • Analysis improvement at forecast initial time of ’99 Christmas storm Martin (26 Dec. 1999 12UTC) for the Tandem-Aeolus scenario large after cycling (Marseille et al, 2007) SOSE – cycling; 84 hours DWL obs. Single-time SOSE; 6 hours DWL obs.
EPS storm probability forecast • Three times more storm members in DWL (30%) than in noDWL (10%) over France and Gulf of Biscay • DWL storm locations are better situated than noDWL
Summary and Conclusions • Aeolus is capable to resolve analysis error structures in data sparse areas and improve state-of-the-art forecasts • Measuring wind vector profiles instead of LOS components over the Northern Hemisphere oceans gives “only” a 50% forecast improvement • A larger and more uniform improvement of 70% is achieved by a more uniform distribution of single-LOS wind observations (tandem Aeolus) • A third Aeolus in orbit provides still a substantial improvement, in particular over the North Atlantic • The results apply for regions precursor for extreme weather as well as for regions of common extratropical weather
Tropics: largest uncertainties An example (Kistler et al., 2001): Zonal mean winds in NCEP and ERA-15 re-analyses. 50% of the Earth’s atmosphere Differences are of the order of the natural variability Potential of new wind measurements in the tropics MISU, 29 October 2005
EUMETSAT Study on Tropical Impact • Objectives • Address dynamical issues of assimilating ADM-Aeolus winds in the tropics. Analysis increments due to LOS winds are more dependent on a priori information than the full wind-field information (Žagar, JAS, 2004) • Compare potential impact of several ADM-Aeolus follow-on scenarios with two DWLs in space • A study by Nedjeljka Žagar, now at NCAR
Impact of ADM follow-on winds in the tropics • A shallow water model example (Žagar, 2004): Spreading of the observed information was modelled, largest weight in practice given to ER waves and large scales, EIG waves given little importance (ECMWF). • This simple case represents also results in the more complex cases ”Truth”: equatorial Rossby wave ADM winds & mass-field data Mass-field data
Conclusions • It is difficult to make use of balance relationships in the tropics, => wind measurements are crucial for the reduction of uncertainties in the tropical analysis fields. • A second satellite can reduce the analysis error by an additional 50% w.r.t. ADM-Aeolus. Poor background-error information makes more observations are needed. • Among three scenarios, dual-inclination scenario provides on average best scores. This is due to the combination of more spatial coverage and the information brought by measuring both wind components. • Due to the weak mass-wind coupling in the tropics, 4D-Var cannot extract information onthe meridional wind component from the Tandem-Aeolus winds to the same extent it can in the extra-tropics.
Prospect post-ADM • Aeolus is expected to improve NWP analyses and forecasts in the tropics and extra tropics. • Aeolus improvements result from uniform sampling and provide a similar relative improvement in extreme and less extreme weather cases • Increased coverage from two satellites is clearly beneficial • To measure dual perspectives is advantageous in the tropics, but zonal measurements alone appear effective in the extratropics • A pair of dual perspective tandem follow-ons is now envisaged, one side-looking and one back-looking at a time (4 satellites) but is considered expensive • International collaboration and exchange will be effective
MetOp-A Launch 19 October 2006 ASCAT scatterometer
First Winds on 27 October 2006 ECMWF FG ASCAT ASCAT QC • Look reasonable • May be improved • Congratulations from ESA, NOAA and NASA HQ • Now the real work starts . . .
Available L1b commissioning sets • SS: 19/10/’06 – 29/01/’07 • ZZ: 30/01/’07 – 12/01/’07 • ZZZ: 13/02/’07 – today • Based on 1 transponder, rain forest and ocean • New set expected after full transponder calibration in June 2007 • Good progress to date, but ocean calibration further improves L2 wind products
Ocean Calibration, OC • OC based on ERS scatterometer heritage • CMOD5.5 empirical wind GMF & ice model knowledge in ERS incidence anglerange • Extrapolated CMOD5.5 GMF & sea ice model in new outer swath range • Purpose: • To provide feedback to EUMETSAT • To disseminate a “demonstration” wind product • Provide continuity of C-band geophysical data sets • Method: • 3D “cone” correction (set internal consistency of measurements) • Enforce the same wind speed distributions across the swath • Use of sea ice model to further verify ocean calibration . Measurements - Ice model CMOD5.5
Mid beam cone correction Vertical cut for WVC #42 (rightmost & new swath) - CMOD5.5 .Upwind . Downwind Level 1b 1st release KNMI visual correction • CMOD5.5 GMF is better fitted due to the down scaling of mid beam measurements
Fore/aft beam cone correction Horizontal projection for WVC #42 - CMOD5.5 .Upwind . Downwind Level 1b 1st release KNMI visual correction • CMOD5.5 is better fitted due to the symmetrical scaling of fore and aft measurements
Uniform backscatter reference • Assume a linear and stable instrument; all L1b calibration changes so far prove to be linear scalings • Use ECMWF wind speed bias at every WVC as absolute wind reference to achieve a uniform absolute reference • Use CMOD5.5 wind speed sensitivity to compute antenna scaling factors at every WVC from WVC speed bias • Assume that the CMOD5.5 backscatter wind speed sensitivity at 8 m/s is representative of the full wind domain sensitivity (quasi-linear dependency and 8 m/s is mean global speed) • This backscatter data scaling would ideally provide the same wind PDF for all WVCs after CMOD5.5 GMF inversion
Wind speed bias correction Vertical cut for WVC #42 . Upwind . Downwind . Upwind . Downwind KNMI cone+wind correction KNMI cone correction • The extrapolated CMOD5.5 GMF is better fitted due to the upward scaling of measurements
Wind speed bias correction Horizontal projection for WVC #42 . Upwind . Downwind . Upwind . Downwind KNMI cone correction KNMI cone+wind correction • The extrapolated CMOD5.5 GMF is better fitted due to the upward scaling of measurements (lower average distance to cone)
Level 1b latest version KNMI corrected Validation against ECMWF • ASCAT inverted winds do not only have lower and more uniform bias w.r.t. ECMWF, but also much lower wind direction SDE (ECMWF + ASCAT error)
ASCAT Ocean Calibration • Winds well within requirements • ECMWF achieved preliminary +ve SH impact • ERS scatterometer compatibility can be achieved • New swath parts provide good winds, but CMOD5.5 may be biased (although over sea ice and land similar biases are observed) • After ASCAT L1b transponder calibration, the KNMI backscattercorrection table should be removed from AWDP and remaining biases incorporated in CMODx.x • Continuity of current ASCAT L2 wind quality is guaranteed over this L1b calibration • Further AWDP checks to improve ASCAT wind services ongoing: Kp’s, MLE, P(V)’s, etc. • ASCAT demonstration wind service since 28 March 2007 • 30-minute Atlantic ASCAT service being set up (EARS)
Vector RMS error [m/s] TAO buoys - Tropical NDBC – Extratropical Buoy 1.5 2.4 Scatterometer 1.2 2.0 ECMWF model 2.0 1.4 Accuray on 50 km scale • Triple collocation analysis of buoy, scatterometer & NWP • Scatterometer winds provide excellent tropical forcing • ECMWF extratropical winds appear excellent, while they are worst in the tropics
ERS scatterometer observes wave train • HiRLAM model (and other NWP models) miss the wave train (too smooth) • The MSG clouds are aligned with the wave train, but in themselves provide little dynamical information • Next day a forecast bust occurred for cloud and precipitation in England and the Netherlands HiRLAM ERS ERS QC
Wave trains are more often seen in scatterometer windsSeaWinds • Exploitation of mesoscale information in NWP data assimilation remains challenging
KNMI ASCAT scatterometer R&D plans> Higher resolution > Closer to the coast > Better wind quality > Higher level products
Back-up MetOp-3 & ADM follow-on ? • Currently not in programmatic scope of Post-EPS since 2019+ • Active wind sensing in 2015 frame problematic • EUMETSAT to proceed with gap analysis following WMO • Programmatic implementation may be sought • Global solutions will be most effective • NOAA support will be valuable