Download
1 / 1
10 likes | 156 Views
Validating Snow Cover Product from NPP VIIRS Peter Romanov 1 , Igor Appel 2 1 Cooperative Remote Sensing Science and Technology Center, City College at City University of New York, NY, USA and

E N D
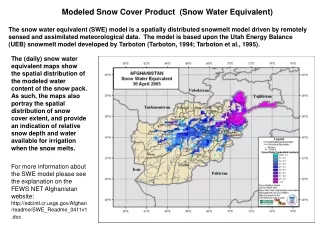
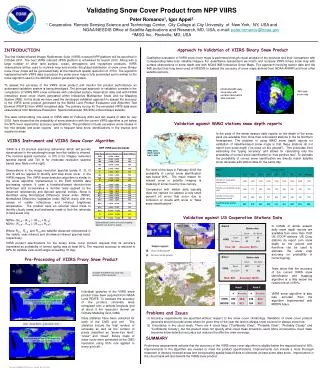
Validating Snow Cover Product from NPP VIIRS Peter Romanov1, Igor Appel2 1 Cooperative Remote Sensing Science and Technology Center, City College at City University of New York, NY, USA and NOAA/NESDIS Office of Satellite Applications and Research, MD, USA, e-mail: peter.romanov@noaa.gov 2IMSG Inc., Rockville, MD, USA INTRODUCTION The first Visible/Infrared Imager Radiometer Suite (VIIRS) onboard NPP platform will be launched in October 2011. The next VIIRS onboard JPSS platform is scheduled for launch 2012. Along with a large number of other land surface, ocean, atmosphere and cryosphere products, VIIRS observations will be used to routinely map and monitor the global distribution of snow cover. Binary snow cover maps will be generated daily at the maximum spatial resolution of 375m. The algorithm implemented with VIIRS data to produce the snow cover map is fully automated and is similar to the snow algorithm used in the MODIS product generation system. To assess the accuracy of the VIIRS snow product and monitor the product performance an automated validation system is being developed. The principal approach to validation consists in the comparison of VIIRS NPP snow retrievals with collocated surface observation data and with NOAA interactive snow cover charts generated within Interactive Multisensor Snow and Ice Mapping System (IMS). In this study we have used the developed validation approach to assess the accuracy of the VIIRS snow product generated by the NASA Land Product Evaluation and Algorithm Test Element (PEATE) from VIIRS simulated data. The primary source for the simulated VIIRS data were observations from Moderate Resolution Spectroradiometer (MODIS) onboard Aqua satellite. The tests incorporating one week of VIIRS data for February 2003 and two weeks of data for July 2003 have shown that the probability of snow detection with the current VIIRS algorithm is yet below the 90% level required by accuracy specifications. The problems include excessive snow misses in the mid latitude and polar regions and in frequent false snow identifications in the tropical and equatorial areas. Approach to Validation of VIIRS Binary Snow Product Qualitative evaluation of VIIRS snow cover maps is performed through visual analysis of the products and their comparison with corresponding false-color satellite imagery. For quantitative assessment we match and compare VIIRS binary snow map with surface observations of snow depth and with NOAA IMS Interactive Snow Maps. The approach involving station data and the IMS product has long been used at NESDIS to assess the accuracy of snow maps derived from NOAA AVHRR and from other satellite sensors. NOAA AVHRR daily snow map with surface observation data overlaid IMS daily snow map Validation against WMO stations snow depth reports In the peak of the winter season daily reports on the depth of the snow pack are available from more than a thousand stations in the he Northern Hemisphere. The problem in using WMO snow depth reports for validation of satellite-based snow maps is that these stations do not report zero snow depth (“no snow on the ground”). This precludes from estimating the “typing accuracy” and allows for calculating only the probability of correct snow identification or “true positive rate”. To estimate the probability of correct snow identification we directly match satellite snow retrievals with station data for the same day. VIIRS Instrument and VIIRS Snow Cover Algorithm NPP VIIRS spectral bands VIIRS is a 22-channel scanning radiometer which will provide observations in the wavelength range from the visible to infrared. The nominal spatial resolution is 375 m for imagery resolution spectral bands and 740 m for moderate resolution spectral bands (see Table on the right). Observations in the image resolution spectral bands I1, I2, I3 and I5 will be applied to identify and map snow cover in the VIIRS imagery. The VIIRS snow detection algorithm is similar to the snow algorithm implemented in the EOS MODIS data processing system. It uses a threshold-based decision-tree technique and incorporates a number tests applied to the observed reflectances and derived spectral indices. Snow is identified using Normalized Difference Snow Index (NDSI), Normalized Difference Vegetation Index (NDVI) along with the values of visible reflectance and infrared brightness temperature. The product uses an external cloud mask to identify cloudy areas and land/water mask to limit the retrievals to land areas only. NDSI= (R 0.6 – R1.6 ) / (R 0.6 + R1.6 ) NDVI= (R 0.8 – R0.6 ) / (R 0.8 + R0.6 ), Where R0.6 R0.8 and R1.6 are satellite-observed relfectances in the visible, near-infrared and shortwave-infrared spectral band, respectively . WMO snow depth reports Feb 2, 2003 For most of the days in February 2003 the probability of correct snow identification was below 90%. The major reason for missed snow in satellite imagery is masking of snow cover by tree canopy. Comparison with station data typically does not capture (or capture a very small percent of) errors that occur due to confusion of clouds with snow or “false snow identifications”. Validation against US Cooperative Stations Data Spectral bands used in the snow mapping algorithm are shown in yellow Area II. In middle of winter season daily snow depth reports are available from more than 1500 US COOP stations. US Coop stations do report zero snow depth on the ground and therefore can be used to estimate the snow map accuracy (or probability of correct typing). Tests show that the accuracy of the current VIIRS snow identification and mapping algorithm is a little below the required level of 90%. VIIRS snow algorithm is also less accurate than the algorithm implemented with MODIS Aqua. II. VIIRS product specifications for the binary snow cover product requires that its accuracy expressed as probability of correct typing was at least 90%. The required accuracy is reduced to 60% for satellite view zenith angle exceeding 70 deg. I. Total: 336 Accuracy: 83.3% Area I. Pre-Processing of VIIRS Proxy Snow Product Example of VIIRS binary snow map granule at 375m resolution Total: 896 Accuracy: 86.9% Individual granules of the VIIRS snow product have been acquired from NASA Land PEATE. To evaluate the accuracy of the product, retrievals were remapped onto a latitude-longitude grid at about 5 km resolution (known as Climate Modeling Grid, CMG) Daily statistics have been collected for each of the CMG grid cell . The statistics include the total number of retrievals as well as the number of pixels classified as “snow-free land”, “snow” and “cloud”. Binary maps of snow cover were generated at the CMG resolution using 50% rule applied to every grid cell. Snow map derived from VIIRS proxy data CMG grid Feb 3, 2003 Problems and Issues • Accuracy requirements are specified without respect to the snow cover climatology. Validation of snow cover product generally should exclude areas where for given time of the year the land is always snow covered or always snow free. • Uncertainty in the cloud mask. There are 4 cloud flags (“Confidently Clear”, “Probably Clear”, “Probably Cloudy” and “Confidently Cloudy”), but the product does not specify what cloud mask should be used. More conservative cloud mask improves snow detection accuracy but reduces the effective area coverage. Gray: clouds White: snow, Green: land SUMMARY Snow map derived from VIIRS proxy data CMG grid, Jul. 13, 2003 Preliminary assessments indicate that the accuracy of the VIIRS snow cover algorithm is slightly below the required level of 90%. Improvements to the algorithm are needed to meet the product specifications. Improvements can include a more thorough treatment of densely forested areas and incorporating spatial-based filters to eliminate at least some false snow. Improvement in the cloud mask will also benefit the VIIRS snow product. Presented at IGARSS 2011 Vancouver, Canada, July 24-29 2011