Download
1 / 31
320 likes | 552 Views
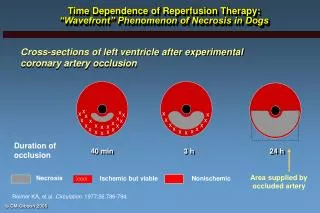
x. x. x. x. x. x. x. x. x. x. x. Time Dependence of Reperfusion Therapy: “Wavefront” Phenomenon of Necrosis in Dogs. Cross-sections of left ventricle after experimental coronary artery occlusion. x. x. x. x. x. x. x. x. x. x. x. x. x. x. x. x. x. x. x. x.

E N D
x x x x x x x x x x x Time Dependence of Reperfusion Therapy:“Wavefront” Phenomenon of Necrosis in Dogs Cross-sections of left ventricle after experimental coronary artery occlusion x x x x x x x x x x x x x x x x x x x x Duration of occlusion 40 min 3 h 24 h Area supplied by occluded artery Necrosis Ischemic but viable Nonischemic XXXX Reimer KA, et al. Circulation. 1977;56:786-794.
Normal Large Capillary Lumen Time is Muscle: Delays in Symptom to Door Time are Associated with Poorer Flow in the Muscle Independent of Flow in Artery 16% rise in risk of a closed muscle for every hour of delay in STEMI (p=0.0005) Gibson, JACC 2004 Normal non-infarcted wall without edema “Blistered” / Swollen Endothelium / wall of the capillary Infarcted wall with edema (white areas) Clinical Picture: Open Artery Closed Muscle EHJ (2004) 25, 794–803 Blistering of Capillaries & Endothelium Interstitial Edema
Time from Symptom Onset to Study Treatment in Large Scale Thrombolytic Trials 2.8 2.7 2.9 2.8 2.7 2.7 Median Time (hrs) Between Symptom Onset and Treatment ASSENT 3 00-01 GUSTO V 99-01 ASSENT II 97-98 GUSTO I 90-93 GUSTO III 95-97 InTIME II 97-99 Gibson CM, Circulation 2001;104:2632-2634
Time-Dependent Benefit of Reperfusion Therapy Adapted from Tiefenbrunn AJ, Sobel BE. Circulation. 1992;85:2311-2315.
Mortality Rate (%) P=0.05 TIMI 2: 6-Week Mortality Adapted from Timm TC, et al. Circulation. 1991;84(suppl II):II-230.
Importance of Time-to-Treatment: Results of GUSTO-I 30-Day Mortality (%) 2=149 (1 df ) Adapted from Lee KL, et al. Circulation. 1995;91:1659-1668.
Time from symptom onset to thrombolysis Rapid Treatment Is Associated With Decreased Mortality Number of lives saved per 1,000 patients treated with fibrinolytics (based on 35-day mortality) 50,246 pt meta-analysis 1983-93 Data source: Boersma E, et al. Lancet. 1996;348:771-775.
P<0.001 P=0.04 MITI: Mortality, Infarct Size, and Time Percent Adapted from Weaver WD, et al. JAMA. 1993;270:1211-1216.
Importance of Door-to-Balloon Time: 30-Day Mortality in the GUSTO-IIb Cohort P=0.001 Mortality (%) > < PTCA not performed Door-to-Balloon Time (minutes) Berger PB, et al. Circulation. 1999;100:14-20.
Patency and Mode of Reperfusion 90-minute patency ED arrival Drug administration Time (minutes) Adapted from Gibson CM. Ann Intern Med. 1999;130:841-847.
Hypothetical Relationship Between Early Reperfusion, Mortality Reduction, and Extent of Myocardial Salvage Mortality Reduction (%) 100 Critical Time-dependent PeriodGoal: Myocardial Salvage Shifts in Potential Outcomes D 80 Time-independent PeriodGoal: Open Infarct-related Artery A-B – No Benefit 60 A-C – Benefit Mortality Reduction, (%) C B-C – Benefit D-B – Harm 40 D-C – Harm 20 B A Extent of Salvage(% of area at risk) 0 0 4 8 12 16 20 24 Time From Symptom Onset to Reperfusion Therapy(hours) Gersh BJ, et al. JAMA. 2005;293:979-986.
Does a 90-Minute Door-to-Balloon Time Matter? Observations From Four Current Reperfusion TrialsEMERALD, COOL MI, AMIHOT, ICE-IT O’Neill, et al. JACC,2005:Suppl A:45:225A.
Time from Symptom Onset to TreatmentPredicts 1-year Mortality after Primary PCI n=1791 The relative risk of 1-year mortality increases by 7.5% for each 30-minute delay De Luca et al, Circulation 2004
Time from Symptom Onset to TreatmentPredicts One-year Mortality 4-6 hrs >6 hrs 2-4 hrs <2 hrs p = 0.006 p = NS p = 0.02 Low-Risk High-Risk All Patients De Luca at al, JACC 2003
Time from Symptom Onset to Treatment Predicts One-year Mortality Among Patients with Occluded Epicardial Arteries 4-6 hrs >6 hrs 2-4 hrs <2 hrs p = 0.013 p = NS Pre-PCI TIMI 0/1 Flow Pre-PCI TIMI 2/3 Flow De Luca at al, JACC 2003
Predictors of Door-to-Balloon Delay in Primary Angioplasty n=40,017 3.7 3.2 Mean Door-to-balloon time (hours) 2.7 2.2 1.7 0 1 2 3 4 5 6 7 8 9 10 11 12 13 14 15 16 17 18 19 20 21 22 23 Time of hospital arrival (24 hour clock) Angeja BG, et al. Am J Cardiol 2002;89:1156-1161)
What is Primary Angioplasty ? • Primary Angioplasty: Door to balloon time <1 hour • Secondary Angioplasty: Door to balloon time 1 - 2 hours • Tertiary Angioplasty: Door to balloon time 2 - 3 hours • Post MI Care: Door to balloon time 3 - 4 hours • Elective Case: > 4 hours CM Gibson 2006
PCI-Related Time Delay vs Mortality Benefitin 22 Randomized Studies of PCI vs Fibrinolytic Therapy DANAMI: on site PCI 90 DB – 50 DN = 40 min delay DANAMI: with transfer 110 DB – 50 DN = 60 min delay “USA AMI” with transfer: 171 DB – 32 DN = 139 min delay For every 10 min delay to PCI: 1 % reduction in Mortality Difference Between PCI & Lysis 23 RCTs N= 7419 p=0.006 Nallamothu and Bates, AJC 2003
Transfer Out Patients n=119,235 Missing Time Intervals n=13,137 ≥20 STEMI Patients Treated NRMI 2,3,4 452,544 Reperfusion Eligible STEMI Patients 1,963 Hospitals 230,648 Patients 1,860 Hospitals Study Population 192,509 Patients 645 Hospitals Treatment of ≥10 patients with Primary PCI and ≥10 patients with Fibrinolytic Therapy Did Not Receive PCI or Fibrinolytic Therapy as Initial Reperfusion n=89,524 Pinto DS … Gibson CM, Circulation 2006
In Hospital Mortality (%) PCI Related Delay (DB-DN) (min) Mortality Increases with Increasing PCI Related Delay For every 30 minute delay, mortality increases 10% Pinto DS … Gibson CM, Circulation 2006
The Advantage of PCI Compared with Fibrinolyisis Decreases as the PCI Related Delay Increases Odds of Death with Fibrinolysis PCI Better Fibrinolysis Better PCI Related Delay (DB-DN) (min) Pinto DS … Gibson CM, Circulation 2006
Randomized Studies* Odds of Death with Fibrinolysis PCI Better Fibrinolysis Better PCI Related Delay (DB-DN) (min) Pinto DS … Gibson CM. Circulation. 2006 *Betriu A. Am J Cardiol. 2005; 95:100-101.
Prehospital Delay & Timing of Reperfusion Strategy Equivalence 10,614 20,424 3,739 PCI Related Delay (DB-DN) Where PCI and Fibrinolytic Mortality Are Equal (Min) 16,119 9,812 5,296 41,774 19,517 Prehospital Delay (min) Pinto DS … Gibson CM, Circulation 2006
Time At Which PCI Looses Superiority In Survival Over Fibrinolysis Varies Depending Upon Patient Risk Pinto DS … Gibson CM, Circulation 2006
ED Time Point 4: DRUG Time Interval III Decision to drug ED Time Point 3: DECISION Time Interval II ECG to decision to treat ED Time Point 2: DATA Time Interval I Door to ECG ED Time Point 1: DOOR Time of Onset The Four Ds NHAAP Recommendations. U.S. Department of Health NIH Publication: 1997:97-3787.
Door to Balloon Times By Transfer Status, Primary PTCA Patients NRMI 1 NRMI 2 NRMI 3 NRMI 4 228 NRMI Transfer-In Patients Minutes (Median) 171 111 NRMI Non-Transfer-In Patients 110: DANAMI Transfer 100 90: DANAMI On Site
Door to Balloon Times <90 Minutes By Transfer Status, Primary PTCA Patients NRMI 1 NRMI 2 NRMI 3 NRMI 4 Non-Transfer-In Patients 39.1 33.6 Percent of Patients Transfer-In Patients 5.3 3.8
Door to Balloon Times <90 Minutes NRMI 1 NRMI 2 NRMI 3 NRMI 4 34.5 % All Patients Percent of Patients 29.4 %
National Trends in AMI Management:Door to Drug Time with Thrombolysis NRMI 1 NRMI 2 NRMI 3 (Activase only)(All lytics) (All lytics) 91 60 75th percentile, 52 39 34 25th percentile, 22 NRMI 1:Includes patients where initial ECG was the method of MI diagnosis NRMI 2 and 3: Includes patients with ST on 1st 12-lead ECG results, where 1st 12-lead ECG date/time = 1st 12-lead ECG with ST and/or BBB date/time Non-transfer-in patients
National Trends in AMI Management:Door to Balloon Time in PPTCA NRMI 2 NRMI 3 116 108 Includes patients with ST on 1st 12-lead ECG results, where 1st 12-lead ECG date/time = 1st 12-lead ECG with ST and/or BBB date/time (non-transfer-in patients)