Download
1 / 60
600 likes | 763 Views
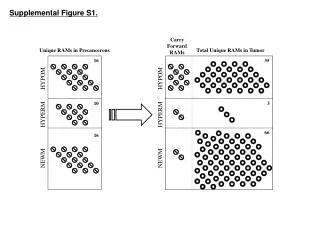
Supplemental Figure S1. Carry Forward RAMs. Unique RAMs in Precancerous. Total Unique RAMs in Tumor. 16. 35. HYPOM. HYPOM. 10. 3. HYPERM. HYPERM. 66. 16. NEWM. NEWM.

E N D
Supplemental Figure S1. Carry Forward RAMs Unique RAMs in Precancerous Total Unique RAMs in Tumor 16 35 HYPOM HYPOM 10 3 HYPERM HYPERM 66 16 NEWM NEWM
Legend – Supplemental Figure 1S. A Summary of Unique Regions of Altered Methylation (RAMs) Observed in C3H/He Constitutive Active/Androstane Receptor (CAR) Phenobarbital (PB)-induced Precancerous and Liver Tumor Tissue, Including Carry Forward RAMs, and Total Unique RAMs in the Tumor Tissue. Liver tumor-prone C3H/He CAR wildtype mice were initiated with a single dose of diethylnitrosamine (DEN), and then treated with 0.05% (w/w) PB in drinking water for 23 (precancerous) or 32 (tumor) weeks. Resistant C3H/He CAR knockout mice were initiated with a single dose of diethylnitrosamine (DEN), and then treated with 0.05% (w/w) PB in drinking water for 23 weeks. PB-induced RAMs in liver tissue were detected in all 3 groups by a procedure involving methylation-sensitive restriction digestion, arbitrarily primed PCR and capillary electrophoresis (Phillips et al., 2007). Unique RAMs in the CAR WT (precancerous and tumor), as compared to the KO, 23 week-PB treated, mice were discerned. Forty-two unique RAMs in the precancerous tissue (⊘), including 14 RAMs which carried forward (i.e. observed in both the precancerous and tumor tissue, ⊘), and 104 unique RAMs in the tumor tissue (O) , are shown. These results were reported previously in Phillips et al. (2007).
Supplemental Figure S2. 5’ 3’ 10 kb 2 kb 2 kb 10 kb 1) Associated with a gene A. Within a gene i. Spans transcriptional start site and/or 5’ untranslated region ii. Exon iii. Intron B. Upstream from transcriptional start site i. < 2 kb ii. < 10 kb and > 2 kb C. Downstream from last exon/intron i. < 2 kb ii. < 10 kb and > 2 kb 2) > 10 kb away from either the transcriptional start site or the last exon/intron 3) Repeat element: multiple “top” hits and one/several are associated with a gene(s) 4) Repeat element: multiple “top” hits and no hits are associated with a gene(s)
Legend – Supplemental Figure S2. Classification of Unique Phenobarbital (PB)-induced Regions of Altered DNA Methylation (RAMs) Based on Their Genomic Locations, as Determined by BLAST-like Sequence Alignment Tool (BLAT) Searches (UCSC Genome Browser, July 2007 Mouse Assembly). Unique RAMs in precancerous and tumor tissue were cloned and subjected to BLAT searches (http://genome.ucsc.edu/cgi-bin/hgBlat?command=start&org=mouse). Depending on where, in relation to a gene, the RAM aligned, it was assigned a particular genomic classification (Phillips et al., 2007). For example, RAMs designated as 1.B.i. are located less than or equal to 2 kb upstream from the transcriptional start site.
Legend – Supplemental Figure S3. The Distribution of Genomic Locations of the Annotated (Including Uncharacterized Regions) Phenobarbital (PB)-induced Unique Regions of Altered DNA Methylation (RAMs) in C3H/He Constitutive Active/Androstane Receptor (CAR) Precancerous and Liver Tumor Tissue. The genomic locations of the annotated (including uncharacterized regions) RAMs are presented based on the classification scheme in Supplemental Figure S2.
Legend - Supplemental Figure S4. The Chromosomal Distribution of the Annotated (Including Uncharacterized Regions) Phenobarbital (PB)-induced Unique Regions of Altered DNA Methylation (RAMs) in C3H/He Constitutive Active/Androstane Receptor (CAR) Precancerous and Liver Tumor Tissue. The chromosomes proceed from 1 to 19, in a clockwise fashion. None of the RAMs aligned to the X or Y chromosomes.
Supplemental Figure S5. Protein tyrosine phosphatase activity GO: 0004725, Protein amino acid phosphorylation GO:0006468 Regulation of transcription, DNA dependent GO:0006355, Negative regulation of transcription GO:0016481 Iron ion transport GO:0006826 branched chain family amino acid catabolic process GO:0009083, Glycoprotein biosynthetic process GO:0009101 Integral to membrane GO:0016021 Pheromone receptor activity GO:0016503, Protein binding GO:0005515 Exosome (RNase complex) GO:0000178 The function of the gene is unknown PCR product is not linked to an annotated gene -- --
Legend - Supplemental Figure S5. Functional Breakdown of the Genes Identified from Unique Phenobarbital (PB)-induced Regions of Altered DNA Methylation (RAMs) in C3H/He Constitutive Active/Androstane Receptor (CAR) Precancerous and Liver Tumor Tissue. The genes representing unique RAMs were broken down into 9 functional categories, 7 of which are based on Gene Ontology (GO) functional information (http://www.geneontology.org); examples of GO functional labels are depicted. For genes in the “unknown” pie slice, no information about them exists in the literature. Regions in the “uncharacterized” pie slice align to the mouse genome greater than 10 kilobases away from an annotated gene.
Supplemental Figure S6. Abl1is involved in a variety of cellular processes, including oncogenesis. The BCR-Abl fusion protein is linked to chronic myelogeneous leukemia. Abl1 positively regulates Myc and is positively regulated by Jun. Abl1 is necessary for p53 accumulation in response to DNA damage. v-abl Abelson murine leukemia viral oncogene homolog 1 (Abl1) is a unique carry forwardhypomethylation
Legend - Supplemental Figure S6. Informatic Analysis of c-Abl Oncogene 1, Receptor Tyrosine Kinase (Abl1) Which Represents a Unique Carry Forward Hypomethylated RAM in both the Precancerous and Liver Tumor Tissue. The protooncogene Abl1 is a cytoplasmic and nuclear protein tyrosine kinase that has been implicated in a variety of cellular processes, including oncogenesis. Solid arrows indicate positive ( ) or negative ( ) interactions between Abl1 and other genes (red symbols) or cellular processes (yellow rectangles). Dotted arrows ( ) indicate involvement of Abl1 in disease states (purple rectangles). The shapes of the entities represent a specific class of molecules to which each gene belongs: extracellular proteins or nuclear receptors ( ), ligands ( ), kinases ( ) and transcription factors ( ).
Supplemental Figure S7. Chn2inhibits proliferation and migration of vascular smooth muscle cells via the regulation of Rac1 activity. Chn2positively regulates cell migration, and is linked to Rac regulation in T-cells. Chn2expression in MCF-7 breast cancer cells leads to inhibition of proliferation and G(1) cell cycle arrest. Chimerin (chimaerin) 2 (Chn2)is newly methylated uniquely in the Precancerous and the Tumor
Legend - Supplemental Figure S7. Informatic Analysis of Chimerin (Chimaerin) 2 (Chn2), a Potential Tumor Suppressor Gene which is Uniquely Newly Methylated in both the Precancerous and Liver Tumor Tissue. Chn2 is involved in growth inhibition. Solid arrows indicate negative ( ) interactions between Chn2 and cellular processes (yellow rectangles). Dotted arrows ( ) indicate involvement of Chn2 in disease states (purple rectangles). The shapes of the entities represent a specific class of molecules to which each gene belongs: kinases ( ).
Supplemental Figure S8. Anxa4overexpression promotes cell migration in a model system of clear cell renal carcinoma. Anxa4overexpression in cancer has been documented. Anxa4has been shown to be involved in a range of physiological functions including ion channel regulation, exocytosis and Ca(2+)-dependent signal transduction. Annexin A4 (Anxa4) is a carry forwardhypomethylation from Precancerous to Tumor
Legend - Supplemental Figure S8. Informatic Analysis of Annexin A4 (Anxa4), Which Represents a Unique Carry Forward Hypomethylation from Precancerous to Liver Tumor Tissue. Anxa4 promotes cellular migration in a model system of renal cell carcinoma. Solid arrows indicate positive ( ) interactions between Anxa4 and other genes (red symbols) or cellular processes (yellow rectangles). Purple lines ( ) indicate physical interactions between 2 entities. Dotted arrows ( ) indicate involvement of Anxa4 in disease states (purple rectangles). The shapes of the entities represent a specific class of molecules to which each gene belongs: extracellular proteins or nuclear receptors ( ) and ligands ( ).
Supplemental Figure S9. Prkceis involved with proteins linked to angiogenesis, such as Vegf, Fgf2, Edn1 and Ednra. Prkcepositively regulates Raf1, which is a Ras effector protein, and Src, both of which are involved in oncogenesis. Prkcenegatively regulates apoptosis-related genes, such as Bcl2 and Fadd. Protein kinase C, epsilon (Prkce) is uniquelyhypomethylatedin the Tumor
Legend - Supplemental Figure S9. Informatic Analysis of Protein Kinase C, Epsilon (Prkce), Which is Uniquely Hypomethylated in Liver Tumor Tissue.Prkce increases growth and survival, decreases apoptosis, and has been linked to oncogenesis. Solid arrows indicate positive ( ) or negative ( ) interactions between Prkce and other genes (red symbols), small molecules (green ovals), or cellular processes (yellow rectangles). Dotted arrows ( ) indicate involvement of Prkce in disease states (purple rectangles). The shapes of the entities represent a specific class of molecules to which each gene belongs: extracellular proteins or nuclear receptors ( ), ligands ( ), kinases ( ), transcription factors ( ), and membrane receptors ( ).
Legend - Supplemental Figure S10. Common Regulators of Genes that were identified from Unique Phenobarbital (PB)-induced Regions of Altered DNA Methylation (RAMs) in C3H/He Constitutive Active/Androstane Receptor (CAR) Wildtype Precancerous Mouse Liver. An informatic approach was utilized to discern regulators that affect 2 or more genes identified from unique PB-induced RAMs in precancerous tissue (23 weeks). Red symbols are common regulators of the unique RAMs. The arrows point away from the common regulator and towards the unique RAM; positive arrows ( ) indicate that the regulator positively affects the RAM. Unique RAMs are hypomethylated (green) or hypermethylated (orange). A combination of colors (e.g., green and orange) depicts a RAM with an ambiguous methylation status in the tumor tissue. A pink center depicts a carry forward RAM from precancerous to tumor tissue. The shapes of the entities represent a specific class of molecules to which the RAM or common regulator belongs: ligands ( ), and kinases ( ).
Legend - Supplemental Figure S11. Common Regulators of Genes Identified from Unique Phenobarbital (PB)-inducedRegions of Altered DNA Methylation (RAMs) in C3H/He Constitutive Active/Androstane Receptor (CAR) Wild-type Mouse Liver Tumor Tissue. An informatic approach was utilized to discern regulators that affect 2 or more genes representing unique PB-induced RAMs in tumor tissue (32 weeks). Red symbols are common regulators of the unique RAMs. The arrows point away from the common regulator and towards the unique RAM; positive arrows ( ) indicate that the regulator positively affects the RAM, while negative arrows ( ) denote a negative effect. Unique RAMs are hypomethylated (green), hypermethylated (orange) or newly methylated (blue). A pink center depicts a carry forward RAM from precancerous to tumor tissue. The shapes of the entities represent a specific class of molecules to which the RAM or common regulator belongs: extracellular proteins or nuclear receptors ( ), ligands ( ), kinases ( ) and transcription factors ( ).
Supplemental Figure S12. 27 26 22,23 * 1, 2 7 19-21 3-6 18 8,9 24,25,14 10 17,18 11,12 15,16 13 * 13,14
Legend - Supplemental Figure S12. Genes Which Exhibited Altered Methylation Uniquely in Precancerous Liver Tissue and Which are Potentially Involved in the Regulation of Angiogenesis. An informatic approach was utilized to discern relationships between unique precancerous RAMs and angiogenesis. Unique RAMs, denoted by asterisks (*), are hypomethylated (green) or hypermethylated (orange). A combination of colors (e.g., green and orange) depicts a RAM with an ambiguous methylation status in the precancerous tissue. A pink center depicts a carry forward RAM from precancerous to tumor tissue. Red symbols are not unique RAMs; they are genes which link unique RAMs to angiogenesis. The positive arrows ( ) indicate that an entity positively affects another gene, and/or angiogenesis directly. The shapes of the entities represent a specific class of molecules to which the RAM or other entity belongs: extracellular proteins or nuclear receptors ( ), ligands ( ) and kinases ( ). Literature references, shown as numbers, for the relationships depicted in this diagram are listed in Supplemental Table S2.
Supplemental Figure S13. 27 * 26 22,23 1,2 28 7 19-21 24,25,14 * 29 3-6 8,9 18 10 30,31 17,18 11,12 15,16 13 * 13,14
Legend - Supplemental Figure S13. Genes Which Exhibited Altered Methylation Uniquely in Liver Tumor Tissue and Which are Potentially Involved in the Regulation of Angiogenesis. An informatic approach was utilized to discern relationships between unique tumor RAMs and angiogenesis. Unique RAMs, denoted by asterisks (*), are hypomethylated (green). A pink center depicts a carry forward RAM from precancerous to tumor tissue. Red symbols are not unique RAMs; they are genes which link unique RAMs to angiogenesis. The positive arrows ( ) indicate that an entity positively affects another entity, and/or angiogenesis directly. The shapes of the entities represent a specific class of molecules to which the RAM or other entity belongs: extracellular proteins or nuclear receptors ( ), ligands ( ) and kinases ( ). Literature references, shown as numbers, for the relationships depicted in this diagram, are listed in Supplemental Table S2.
Supplemental Figure S14. * 13,14 24,25,14 * 46,47 32 33,34 35-37 40-42 38,39 *
Legend - Supplemental Figure S14. Genes Which Exhibited Altered Methylation Uniquely in Precancerous Liver Tissue and Which are Potentially Involved in the Regulation of Apoptosis. An informatic approach was utilized to discern relationships between unique precancerous RAMs and apoptosis. Unique RAMs, denoted by asterisks (*), are hypomethylated (green) or hypermethylated (orange). A combination of colors (e.g., green and orange) depicts a RAM with an ambiguous methylation status in the precancerous tissue. A pink center depicts a carry forward RAM from precancerous to tumor tissue. Red symbols are not unique RAMs; they are genes which link unique RAMs to apoptosis. The arrows indicate whether an entity positively ( ) or negatively ( ) affects another gene, and/or apoptosis directly. The shapes of the entities represent a specific class of molecules to which the RAM or other entity belongs: extracellular proteins or nuclear receptors ( ), ligands ( ) and kinases ( ). Literature references, shown as numbers, for the relationships depicted in this diagram are listed in Supplemental Table S2.
Supplemental Figure S15. * 13,14 * 30,31 24,25,14 * 46,47 44-47 32 43 33,34 35-37 38,39 48 40-42 * *
Legend - Supplemental Figure S15. Genes Which Exhibited Altered Methylation Uniquely in Liver Tumor Tissue and Which are Potentially Involved in the Regulation of Apoptosis. An informatic approach was utilized to discern relationships between unique tumor RAMs and apoptosis. Unique RAMs, denoted by asterisks (*), are hypomethylated (green), hypermethylated (orange) or newly methylated (blue). A combination of colors (e.g., green and blue) depicts a RAM with an ambiguous methylation status in the tumor tissue. A pink center depicts a carry forward RAM from precancerous to tumor tissue. Red symbols are not unique RAMs; they are genes which link unique RAMs to apoptosis. The arrows indicate whether a gene positively ( ) or negatively ( ) affects another gene, and/or apoptosis directly. The shapes of the entities represent a specific class of molecules to which the RAM or other entity belongs: extracellular proteins or nuclear receptors ( ), ligands ( ), kinases ( ) and phosphatases ( ). Literature references, shown as numbers, for the relationships depicted in this diagram are listed in Supplemental Table S2.
Twist Supplemental Figure S16. * * 19-21 11, 49-51 * 13,14 52,53 54,55 56 15,16,57 58 Snail SIP1 EMT Program1 E-cadherin α-catenin β-catenin Vimentin Fibronectin N-cadherin Epithelial markers repressed Mesenchymal markers induced
Legend - Supplemental Figure S16. Genes Which Exhibited Altered Methylation Uniquely in Precancerous Liver Tissue and Which are Potentially Involved in the Regulation of Epithelial-Mesenchymal Cell Transition (EMT). An informatic approach was utilized to discern relationships between unique precancerous RAMs and EMT. Unique RAMs, denoted by asterisks (*), are hypomethylated (green) or hypermethylated (orange). A combination of colors (e.g., green and orange) depicts a RAM with an ambiguous methylation status in the precancerous tissue. A pink center depicts a carry forward RAM from precancerous to tumor tissue. Red symbols are not unique RAMs; they are genes which link unique RAMs to EMT. The arrows indicate whether an entity positively ( ) or negatively ( ) affects another gene, and/or EMT directly. The shapes of the entities represent a specific class of molecules to which the RAM or other entity belongs: extracellular proteins or nuclear receptors ( ), ligands ( ), and kinases ( ). Literature references, shown as numbers, for the relationships depicted in this diagram are listed in Supplemental Table S2. 1The annotated RAMs depicted have been superimposed on a modification of a schematic of the EMT program (Zvaifler, 2006).
Twist Supplemental Figure S17. * * 11, 49-51 19-21 * * 13,14 54,55 52,53 30,31 59,60 56 15,16, 57 * 58 Snail SIP1 61 EMT Program1 E-cadherin α-catenin β-catenin Vimentin Fibronectin N-cadherin Epithelial markers repressed Mesenchymal markers induced
Legend - Supplemental Figure S17. Genes Which Exhibited Altered Methylation Uniquely in Liver Tumor Tissue and Which are Potentially Involved in the Regulation of Epithelial-Mesenchymal Cell Transition (EMT). An informatic approach was utilized to discern relationships between unique tumor RAMs and EMT. Unique RAMs, denoted by asterisks (*), are hypomethylated (green). A pink center depicts a carry forward RAM from precancerous to tumor tissue. Red symbols are not unique RAMs; they are genes which link unique RAMs to EMT. The arrows indicate whether an entity positively ( ) or negatively ( ) affects another gene, or EMT directly. The shapes of the entities represent a specific class of molecules to which the RAM or other entity belongs: extracellular proteins or nuclear receptors ( ), ligands ( ), and kinases ( ). Literature references, shown as numbers, for the relationships depicted in this diagram are listed in Supplemental Table S2. 1The annotated RAMs depicted have been superimposed on a modification of a schematic of the EMT program (Zvaifler, 2006).
Supplemental Figure S18. 62 64 24,25,14 * * 40-42 63 65,66 70 80 54,55 * 79 67-69 * 49, 71-73 75 * 74 *
Legend - Supplemental Figure S18. Genes Which Exhibited Altered Methylation Uniquely in Precancerous Liver Tissue and Which are Potentially Involved in the Regulation of Migration, Invasion and Metastasis. An informatic approach was utilized to discern relationships between unique precancerous RAMs and migration/invasion/metastasis. Unique RAMs, denoted by asterisks (*), are hypomethylated (green), hypermethylated (orange), or newly methylated (blue). A combination of colors (e.g., green and orange) depicts a RAM with an ambiguous methylation status in the precancerous tissue. A pink center depicts a carry forward RAM from precancerous to tumor tissue. Red symbols are not unique RAMs; they are genes which link unique RAMs to migration/invasion/metastasis. The arrows indicate whether an entity positively ( ) or negatively ( ) affects another gene, and/or migration/invasion/metastasis directly. The shapes of the entities represent a specific class of molecules to which the RAM or other entity belongs: extracellular proteins or nuclear receptors ( ), ligands ( ) and kinases ( ). Literature references, shown as numbers, for the relationships depicted in this diagram are listed in Supplemental Table S2.
Supplemental Figure S19. 62 30,31 * 64 24,25,14 * 81 * 40-42 63 65,66 81-83 70 80 54,55 * 79 67-69 78 49, 71-73 * * 77 75 108 74 * * 76 * *
Legend - Supplemental Figure S19. Genes Which Exhibited Altered Methylation Uniquely in Liver Tumor Tissue and Which are Potentially Involved in the Regulation of Migration, Invasion and Metastasis. An informatic approach was utilized to discern relationships between unique tumor RAMs and migration/invasion/metastasis. Unique RAMs, denoted by asterisks (*), are hypomethylated (green), hypermethylated (orange) or newly methylated (blue). A pink center depicts a carry forward RAM from precancerous to tumor tissue. Red symbols are not unique RAMs; they are genes which link unique RAMs to migration/invasion/metastasis. The arrows indicate whether an entity positively ( ) or negatively ( ) affects another gene, and/or migration/invasion/metastasis directly. The shapes of the entities represent a specific class of molecules to which the RAM or other entity belongs: extracellular proteins or nuclear receptors ( ), ligands ( ), kinases ( ) and transcription factors ( ). Literature references, shown as numbers, for the relationships depicted in this diagram are listed in Supplemental Table S2.
Supplemental Figure S20. 97 14,24,25 40-42 13,14 * 89 * 12 11,12 14 13,14,96 10,12,98 90,99 93-95 90 91,92 89 20 54,55 85 37,87,88 70 79,84 87,88 * 33,34 84 * 37,86
Legend - Supplemental Figure S20. Genes Which Exhibited Altered Methylation Uniquely in Precancerous Liver Tissue and Which are Potentially Involved in the Regulation of Growth and Survival. An informatic approach was utilized to discern relationships between unique precancerous RAMs and growth/survival. Unique RAMs, denoted by asterisks (*), are hypomethylated (green), hypermethylated (orange) or newly methylated (blue). A combination of colors (e.g., green and orange) depicts a RAM with an ambiguous methylation status in the precancerous tissue. A pink center depicts a carry forward RAM from precancerous to tumor tissue. Red symbols are not unique RAMs; they are genes which link unique RAMs to growth/survival. The arrows indicate whether an entity positively ( ) or negatively ( ) affects another gene, and/or growth/survival directly. The shapes of the entities represent a specific class of molecules to which the RAM or other entity belongs: extracellular proteins or nuclear receptors ( ), ligands ( ) and kinases ( ). Literature references, shown as numbers, for the relationships depicted in this diagram are listed in Supplemental Table S2.
Supplemental Figure S21. 97 14,24,25 40-42 43 13,14 * * * 89 30,31 12 11,12 14 100-102 13,14,96 * 10,12,98 5 5,31,103 90,99 93-95 61,104 90 91,92 47,105 89 * 20 106 77 37,87,88 * 85 54,55 70 87,88 * 79,84 76 33,34 * * 84 37,86 107 *
Legend - Supplemental Figure S21. Genes Which Exhibited Altered Methylation Uniquely in Liver Tumor Tissue and Which are Potentially Involved in the Regulation of Growth and Survival. An informatics approach was utilized to discern relationships between unique tumor RAMs and growth/survival. Unique RAMs, denoted by asterisks (*), are hypomethylated (green), hypermethylated (orange) or newly methylated (blue). A combination of colors (e.g., green and blue) depicts a RAM with an ambiguous methylation status in the tumor tissue. A pink center depicts a carry forward RAM from precancerous to tumor tissue. Red symbols are not unique RAMs; they are genes which link unique RAMs to growth/survival. The arrows indicate whether an entity positively ( ) or negatively ( ) affects another gene, and/or growth/survival directly. The shapes of the entities represent a specific class of molecules to which the RAM or other entity belongs: extracellular proteins or nuclear receptors ( ), ligands ( ), kinases ( ), phosphatases ( ) and transcription factors ( ). Literature references, shown as numbers, for the relationships depicted in this diagram are listed in Supplemental Table S2.
Legend - Supplemental Figure S22. Informatic Analysis of Ephrin B2 (Efnb2), a Gene Identified from Identical, Unique Phenobarbital (PB)-induced RAMs that Formed in Both CAR Wildtype, on a C3H/He Background (Precancerous Liver and/or Liver Tumors), and B6C3F1 (2 and/or 4 Week Treated Liver Tissue) Mice. Efnb2 is a ligand which is involved in angiogenesis. The RAM (M564-566) representing this gene exhibits PB-induced hypomethylation or new methylation in B6C3F1 mice at 2 weeks, hypermethylation in CAR precancerous tissue, and hypomethylation in CAR tumor tissue (Table 3). Solid arrows indicate positive ( ) interactions between Efnb2 and other genes (red symbols) or cellular processes (yellow rectangles). Purple lines ( ) indicate physical interactions between 2 entities. The shapes of the entities represent a specific class of molecules to which each gene belongs: extracellular proteins or nuclear receptors ( ), ligands ( ), and membrane receptors ( ).
Legend - Supplemental Figure S23. Informatic Analysis of Prickle-like 2 (Drosophila) (Prickle2), a Gene Identified from Identical, Unique Phenobarbital (PB)-induced RAMs that Formed in Both CAR Wildtype, on a C3H/He Background (Precancerous Liver and/or Liver Tumors), and B6C3F1 (2 and/or 4 Week Treated Liver Tissue) Mice. Prickle2 is a component of the Wnt-regulated planar cell polarity pathway. One RAM (H310-312) representing this gene exhibits PB-induced hypomethylation in B6C3F1 mice at 2 and 4 weeks and in CAR tumor tissue, and either hypermethylation or hypomethylation in CAR precancerous tissue (Table 3). The second RAM (B310-312) representing this gene exhibits PB-induced hypomethylation in B6C3F1 mice at 4 weeks and CAR tumor tissue, and new methylation in B6C3F1 mice at 2 weeks (Table 3). Since the methylation statuses of both of these RAMs change in the same direction in B6C3F1 and CAR WT mice (exceptions include an ambiguous change in the CAR precancerous tissue for H310-312, and an opposite change in the B6C3F1, 2 week group for B310-312), Prickle2 is a second-tier candidate gene that might contribute to an “altered methylation fingerprint” which could be utilized as a biomarker to identify PB-like nongenotoxic liver tumor promoters. Solid arrows indicate positive ( ) interactions between Prickle2 and other genes (red symbols) or cellular processes (yellow rectangles). Dotted arrows ( ) indicate involvement of Prickle2 in disease states (purple rectangles) or signaling pathway (orange hexagon). Purple lines ( ) indicate physical interactions between 2 entities. The shapes of the entities represent a specific class of molecules to which each gene belongs: extracellular proteins or nuclear receptors ( ) and membrane receptor ( ).
Legend - Supplemental Figure S24. Informatic Analysis of Protein Tyrosine Phosphatase, Receptor Type, O (Ptpro), a Gene Identified from Identical, Unique Phenobarbital (PB)-induced RAMs that Formed in Both CAR Wildtype, on a C3H/He Background (Precancerous Liver and/or Liver Tumors), and B6C3F1 (2 and/or 4 Week Treated Liver Tissue) Mice.Ptpro possesses properties of a classical tumor suppressor gene. One RAM (H340-343) representing this gene exhibits PB-induced hypomethylation or new methylation in B6C3F1 mice at 2 weeks, and hypomethylation or new methylation in CAR tumor tissue (Table 3). The second RAM (B341-42) representing this gene exhibits PB-induced hypomethylation in B6C3F1 mice at 2 and 4 weeks and in CAR tumor tissue (Table 3). Since the methylation statuses of the B341-42 RAM change in the same direction in B6C3F1 and CAR WT mice, Ptpro is a preliminary candidate for the development of an “altered methylation fingerprint” which could be utilized as a biomarker to identify PB-like nongenotoxic liver tumor promoters. Solid arrows indicate positive ( ) or negative ( ) interactions between Ptpro and others gene (red symbols), small molecules (green ovals), or cellular processes (yellow rectangles). Dotted arrows ( ) indicate involvement of Ptpro in disease states (purple rectangles). Purple lines ( ) indicate physical interactions between 2 entities. The shapes of the entities represent a specific class of molecules to which each gene belongs: extracellular proteins or nuclear receptors ( ) and phosphatases ( ).
Legend - Supplemental Figure S25. Informatic Analysis of Transcription Factor 4 (Tcf4), a Gene Identified from Identical, Unique Phenobarbital (PB)-induced RAMs that Formed in Both CAR Wildtype, on a C3H/He Background (Precancerous Liver and/or Liver Tumors), and B6C3F1 (2 and/or 4 Week Treated Liver Tissue) Mice.Tcf4 heterodimerizes with beta-catenin to regulate transcription of target genes. Tcf4 is involved a variety of cellular processes, including oncogenesis. One RAM (H200) representing this gene exhibits PB-induced hypomethylation in B6C3F1 mice at 2 weeks, and new methylation in CAR tumor tissue (Table 3). The second RAM (B200) representing this gene exhibits PB-induced increases in methylation in B6C3F1 mice at 2 weeks (hypermethylation) and in CAR tumor tissue (new methylation), plus hypomethylation in B6C3F1 mice at 4 weeks (Table 3). Since the methylation statuses of the B200 RAM change in the same direction in B6C3F1 and CAR WT mice (with the exception of an opposite change in the B6C3F1, 4 week group), Tcf4 is a second-tier candidate gene that might contribute to an “altered methylation fingerprint” which could be utilized as a biomarker to identify PB-like nongenotoxic liver tumor promoters. Solid arrows indicate positive ( ) or negative ( ) interactions between Tcf4 and other genes (red symbols) or cellular processes (yellow rectangles). Dotted arrows ( ) indicate involvement of Tcf4 in disease states (purple rectangles). Purple lines ( ) indicate physical interactions between 2 entities. The shapes of the entities represent a specific class of molecules to which each gene belongs: extracellular proteins or nuclear receptors ( ), ligands ( ), transcription factors ( ), and membrane receptors ( ).