Curve di Costo
170 likes | 369 Views
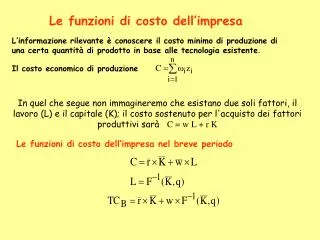
Curve di Costo. Esprime la dipendenza del tempo di percorrenza dell’arco in funzione del flusso che vi transita. Una delle espressioni più note è la funzione BPR:. t a = tempo impiegato dal flusso q a a percorrere l’arco a t 0 = tempo impiegato a percorrere l’arco a a flusso nullo

Curve di Costo
E N D
Presentation Transcript
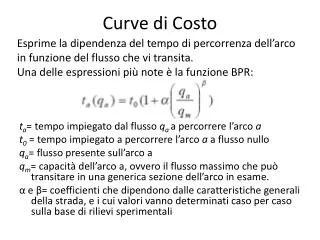
Curve di Costo Esprime la dipendenza del tempo di percorrenza dell’arco in funzione del flusso che vi transita. Una delle espressioni più note è la funzione BPR: ta= tempo impiegato dal flusso qaa percorrere l’arco a t0 = tempo impiegato a percorrere l’arco aa flusso nullo qa= flusso presente sull’arco a qm= capacità dell’arco a, ovvero il flusso massimo che può transitare in una generica sezione dell’arco in esame. α e β= coefficienti che dipendono dalle caratteristiche generali della strada, e i cui valori vanno determinati caso per caso sulla base di rilievi sperimentali
Tangenziale Est 40 V0=90 km/h
Viale Regina Margherita 72 V0=50 km/h
Via Tiburtina 72 V0=50 km/h
Via Albano 120 V0=30 km/h
Via Salaria V0=90 km/h 40