Download
1 / 27
270 likes | 466 Views
COLOR HISTOGRAM AND DISCRETE COSINE TRANSFORM FOR COLOR IMAGE RETRIEVAL. Presented by 2006/8. Outline. 1. Introduction. 2. Feature Extraction. 3. Distance Measurement. 4. Screening Scheme. 5. Experimental Results. 6. Conclusions. 1. Introduction. Two approaches for image retrieval:

E N D
COLOR HISTOGRAM ANDDISCRETE COSINE TRANSFORMFOR COLOR IMAGE RETRIEVAL Presented by 2006/8
Outline 1. Introduction 2. Feature Extraction 3. Distance Measurement 4. Screening Scheme 5. Experimental Results 6. Conclusions
1. Introduction • Two approaches for image retrieval: • query-by-text (QBT): annotation-based image retrieval (ABIR) • query-by-example (QBE): content-based image retrieval (CBIR) • Drawbacks of ABIR: • time-consuming and therefore costly. • human annotation is subjective. • some images could not be annotated because it is difficult to describe their content with words. • Standard CBIR techniques can find the images exactly matching the user query only.
The histogram measures • They are only dependent on summations of identical pixel values and do not incorporate orientation and position. • The histogram is only statistical distribution of the colors and loses the local information of the image. • The images retrieved by using the color histogram only may not be desired even though they share similar color distribution. • Transform type feature extraction techniques • Wavelet, Walsh, Fourier, 2-D moment, DCT, and Karhunen-Loeve. • In our approach, the DCT is used to extract the spatial features of images.
In our approach, each image is first transformed from the standard RGB color space into the YUV space for the purpose of extracting the features based on color tones easily. • Then, two types of features are extracted from the YUV color space: • Color features • Spatial features • In the image database establishing phase • the features of each image are stored; • In the image retrieving phase • the system compares the features of the query image with those of the images in the database, using the Euclidean distance metric and find out good matches.
2. Feature Extraction • A color space is a model for representing color in terms of intensity values. • There exist many models: • RGB (Red, Green, and Blue), • CMYK (Cyan, Magenta, Yellow, and Black Key), • YUV (Luminance and Chroma channels), and • HSV (Hue, Saturation, and Value ), etc.
2.1 Color Conversion • RGB Color Space • For a gray-level digital image • It can be defined as a function of two variables, f(x, y), where x and y are spatial coordinates, and the amplitude f at a given pair of coordinates is called the intensity of the image at that point. • For a color image • each pixel (x, y) consists of three components: R(x, y), G(x, y), and B(x, y), each of which corresponds to the intensity of the red, green, and blue color in the pixel, respectively.
YUV Color Space • Originally used for PAL (European "standard") analog video • The Y primary was specifically designed to follow the luminous efficiency function of human eyes. • Chrominance is the difference between a color and a reference white at the same luminance. • The following equations are used to convert from RGB to YUV color space:
2.2 Color Histogram • The color histogram for an image is constructed by discretizing (or quantizing) the colors within the image and counting the number of pixels of each color. • More formally, it is defined as • For gray-scale images these are 2-D vectors. • One dimension gives the value of the gray-level and the other the count of pixels at the gray-level. • As for color images • each color channel can be regarded as gray-scale images. • More generally, we can set the number of bins in the color histograms to obtain the feature vector of desired size.
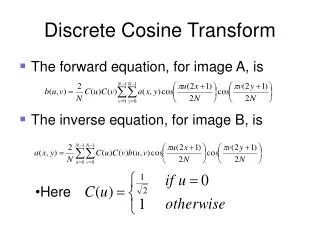
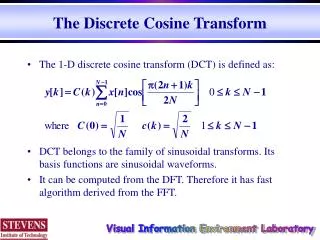
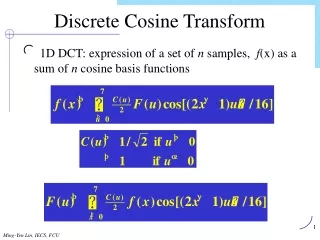
2.3 Discrete Cosine Transform • The DCT coefficients C(u, v) of an M×N image represented by f(i, j) can be defined as where
4. Distance Measurement • To decide which image in the image database is the most similar one with the query image, we have to define a measure to indicate the degree of similarity. • Therefore, the distance (or dissimilarity) between the feature vector of the query image and that of an image in the database is based on the distance function.
Assume that qm and xm represent the mth feature of the query image Q and an image X in the database, respectively. • Each feature may come from either the color histograms or the DCT coefficients. Then, the distance between qm and xm can be defined as • The total distance is:
5. Screening Scheme • Three color features are used for screening: • luminance, blue chrominance, and red chrominance • The goals of the screening scheme: • 1. Speed up the image retrieving process: • The concept underlying screening is to eliminate the obviously unqualified candidates via a certain criterion. • 2. Conform to the users’ requirements: • Numerical measurements of the distances of the three color features are mapped into a reduced set of qualitative linguistic labels: Same, Very Similar, Not Very Similar, and All.
To filter out the images which are dissimilar to the query image Q from the aspect of the distance derived from the mth feature, d(qm, xm), we devise the distance threshold for the kth precision label as: • where m = 1(luminance), 2(blue chrominance), and 3(red chrominance); • k= 1(Same), 2(Very Similar), 3(Similar); • mmis the mean of the d(qm, xm), which is defined as follows:
Figure 1. Illustration of the distance thresholds for the screening under various precision labels.
5. Experimental Results • We evaluated performance on a test image database, which was downloaded from the WBIIS. • It is a general-purpose database including 1,000 color images. • The images are mostly photographic and have various contents, such as natural scenes, animals, insects, building, people, and so on.
To compare the three color spaces and their components in a quantitative manner, three classes of query images, referring to • white owl (5 images), pumpkins (4 images, and deer (9 images), are served as the benchmark queries. • To assess the ground-truth relevance score to each image for each benchmark query, each target image in the collection is assigned a relevance score as follows: • 1 if it belonged to the same class as the query image, • 0 otherwise. • The process was repeated for all the relevant images and an overall average retrieval effectiveness was computed for each of the color component and each of the query example. • The overall average relevance score in top 10 was computed by averaging the individual values in each top 10. The bin number used for each color component is 5.
6. Conclusions • We propose a CBIR method benefited from the robustness of color histograms and the energy compacting property of DCT. • In our approach, each image is first transformed into the YUV space for the purpose of extracting the features based on color tones more easily. • Then, the color and spatial features of the images can be derived from their color histograms and DCT coefficients. • In our CBIR system, users can retrieve the desired images efficiently via the system’s interactive user interface and the proposed screening scheme. • Future works include the incorporation of the coarse classification scheme and other kinds of transform-based features to the system.