Download

1 / 25
250 likes | 446 Views
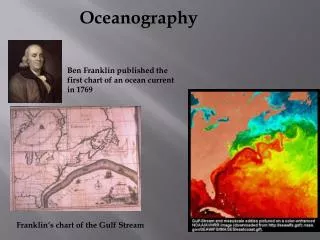
Oceanography. Ben Franklin published the first chart of an ocean current in 1769. Franklin’s chart of the Gulf Stream. Physical Oceanography. Surface currents. Bathymetry. Tides. Deep water currents. Geological Oceanography. Chemical Oceanography. Dissolved Oxygen and other gases

E N D
Oceanography Ben Franklin published the first chart of an ocean current in 1769 Franklin’s chart of the Gulf Stream
Physical Oceanography Surface currents Bathymetry Tides Deep water currents
Chemical Oceanography Dissolved Oxygen and other gases • Fish and other animals need oxygen to breathe. This oxygen is present in the water and is called dissolved oxygen (DO). It is measured in mg/L. • <3 mg/L – harmful to fish – too little O2 • 5-6 mg/L – desirable range • >10 mg/L – harmful to fish – too much O2 Dissolved minerals and other solids Salinity – amount of salt in water, measured in parts per thousand (ppt)
Biological oceanography • Otherwise known as Marine Biology
MeteorologyHurricanes Formation of Hurricanes
www.hurricanehunters.com Photo by: Jill Turner Physics Eye wall of Hurricane Ivan 2004 Hurricane Katrina 2005
oceanographic tools • Properties of water measured: • Parameters, units, significance • Temperature • Salinity • Dissolved oxygen • Turbidity • Light levels • Depth…
these properties vary with depth • Typical open ocean profiles • Called - a hydrocast
Tools to measure these properties - depth • Sounding lines • Problems… (currents) • Pressure sensor • Sonar
Tools to measure these properties - salinity • Direct or indirect measurement • Refractometer • Conductivity sensor
Tools to measure these properties - turbidity • Secchi disk • transmissometer
Tools to measure these properties - dissolved oxygen • Methods – chemical and electrical Winkler Polarigraphic electrode
Tools to measure these properties - light • Photosyntheticallyactive radiation (PAR) sensor • Deck sensor
Water samplers Niskinbottle
Other parameters • Chlorophyll levels - fluorometer
Hydrolab/YSI = brands Monitoringunits
Combined units • moored, deployed, mobile • CTD • Argo ’floats’
CTD hydrocast See our CTD hydrocast
The Quest for Longitude -- 1707 shipwreck of four British warships -- 2000 dead -- LongitudeAct of 1714 -- John Harrison http://www.pbs.org/wgbh/nova/longitude/
Global Positioning Systems Image from Wikipedia.com
Waypoint = latitude/longitude Used with permission from Garmin
GPS APPLICATIONS Images from seaturtle.org
Gulf of Mexico MEXICO