Download
1 / 1
10 likes | 121 Views
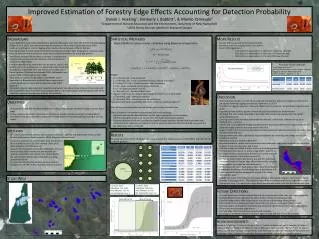
Improved Estimation of Forestry Edge Effects Accounting for Detection Probability Daniel J. Hocking 1 , Kimberly J. Babbitt 1 , & Mariko Yamasaki 2 1 Department of Natural Resources and the Environment, University of New Hampshire 2 USDA Forest Service, Northern Research Station. Background

E N D
Improved Estimation of Forestry Edge Effects Accounting for Detection Probability Daniel J. Hocking1, Kimberly J. Babbitt1, & Mariko Yamasaki2 1Department of Natural Resources and the Environment, University of New Hampshire 2USDA Forest Service, Northern Research Station • Background • Forest-dependent salamander abundance is generally reduced by more than 50% initially following logging (Tilghman et al. 2012), and can be extremely abundance in mature forest habitat (Petranka 1998) • Land-use modifications, such as logging, often create ecotones between different habitats • Even-aged timber harvests create environmental gradients varying in light, temperature, moisture, vapor pressure deficit, humidity, and shrub cover, altering habitat conditions for plants and animals • We expect a logistic-type response in woodland salamander abundance along a harvest-forest edge with few salamanders deep in the cuts, increasing abundance in the edge habitat, and leveling off at the forest population carrying capacity some distance into the forest • Statistical Methods • Royle (2004) N-mixture model, estimates using Bayesian computation • ) • ) • Priors • B ~ uniform(3, 30) – Rate Parameter • C ~ uniform(0, 10) – Lower asymptote (carrying capacity of harvest) • D ~ uniform(-20, 20) – Inflection point (x-shift parameter) • K = 30 – Upper asymptote (carrying capacity forest) • A = K – C (Upper asymptote control) • bi ~ Normal(0, σ2) – Random effect of site i • Loge(σ) ~ uniform(1, 3) – Natural log of standard deviation for random effect • α ~ Normal(0, 100) – Detection intercept • β ~ Normal(0, 100) – Detection covariate coefficients • Parameters estimated using MCMC with Gibbs sampling in JAGS via rjags in R • Effect of shape on salamander loss per hectare cut in circles of various sizes • Effect of shape on salamander loss per hectare cut in real landscape • Digitized additional 28 additional cuts from the region that varied in size and shape • Converted polygons to points on 5m grid with 50m buffer around each polygon • Calculated distance of points to cut edge and applied logistic equation derived from salamander data • Conducted linear regression on Proportion lost compared to equal size reference habitat using area and perimeter:area ratio as covariates • More Results • Assume 460 ha area and want to harvest 100 ha • Assume circular cuts ranging from 1 ha to 100 ha • Result: 22% logged area = • 21% decline in salamanders in 100 ha cuts (24% area effected) • 22% decline in salamanders in 10 ha cuts (31% area effected) • 26% decline in salamanders in 1 ha cuts (55% area effected) Area 10 ha cut Area 1 ha cut • Amphibians are especially sensitive to changes in moisture and temperature and may alter their behavior and distributions in response to edge habitat • Forestry edge effects on amphibians vary by species, season, and location, but in the northeastern US, forest-dependent amphibian abundance is reduced 20-35 m into forests surrounding recent timber harvests ((DeGraaf and Yamasaki 2002; deMaynadier and Hunter 1998; Urbina-Cardona et al. 2006) • Most previous studies of edge effects used ANOVA, Linear Regression, or Nonparametric methods (Loess regression or smoothing splines) on count data to determine edge effect distances Projection on Real Landscape Linear Regression Results Number of salamanders lost per hectare following logging as function of Perimeter|Area adj-R2 = 0.988; F = 2486, DF = 1, 35 Circular Harvests 1ha 1ha • Discussion • Red-backed salamanders, as with other woodland salamanders, experience significant reduction in abundance following logging (reviewed by Tilghman et al. 2012) • The effect of logging is greater in areas with higher maximum summer temperatures (Tilghman et al. 2012) • Edge effects have ability to greatly increase the total area effected by timber harvest • We found that red-backed salamanders reach 95% of forest carrying capacity 34 m into forest surrounding harvests • Carrying capacity was previously estimated from adjacent, undisturbed, reference forest plots (Hocking et al. in review) • Smaller and more irregularly-shaped cuts have greater total areas effected than large, round curs (less perimeter:edge) to extract the same amount of timber • Larger circular cuts (> 10 ha) have less impact on total salamander abundance than small circles totally the same harvested area • High perimeter:area ratios significantly reduce abundance by increasing area of edge per cut unit • Benefits of method • Method accounts for imperfect detection • Because parametric, results can be projected across landscapes and used to estimate the total effect of planned cuts of various sizes and shapes • Decades are required for population recovery following clearcutting; however, little is known about recovery in the edge habitat. The balance of internal harvest effects and exterior edge effects could change over time. This reduction in edge effects would make smaller cuts less detrimental over time. 10 ha • Objectives • To account for imperfect detection to determine unbiased salamander abundance along a harvest-forest edge • To use nonlinear, parametric regression to quantify salamander abundance along this edge gradient • Quantify the change in abundance accounting for edge effects for harvests (patches) varying in size and shape Cut Area: 10 ha Edge/Area: 354 m/ha Area Effected: 25.7 ha Rel. Salamander Loss: 1.2 Cut Area: 10 ha Edge/Area: 112 m/ha Area Effected: 14.2 ha Rel. Salamander Loss: 1 • Methods • Nine sites harvested the previous year varying in size (0.06 – 10.8 ha) and shape and 8 reference sites (undisturbed forest) in New Hampshire White Mountain National Forest Results We captured a total of 308 red-backed salamanders during 4 sampling occasions in fall 2000 at 110 plots over 9 cut-forest gradients • Transect at each harvest site with plots from -80 into cut to 80 m outside the cut at 10-20 m intervals. Three plots were located in each reference site • At each plot red-backed salamanders (Plethodoncinereus) were counted under coverboards and adjacent 1m2 searches of leaf litter and natural cover objects (NCO) • We sampled each plot 4 times in fall 2000, assuming population closure • At each plot and sampling occasion, we measured soil temperature, number of NCO searched, and soil moisture • This method can be applied to other species and habitat gradients • The balance of the interior vs. exterior edge effects depends on the shape of the curve, especially the steepness of the response (B) and the location of the inflection point (D) • If inflection point shifted right (into forest) and the response is shallower (smaller B = longer edge effect) then smaller cuts and more irregular cuts might be more detrimental • While many small cuts initially appear detrimental to red-backed salamander abundance, these findings have to be balances with timber and multi-species management as well as long-term management goals Study Area • Future Directions • Consider how best to include random effect of site on parameters other than just upper asymptote • Examine effect of close proximity cuts where buffers overlap (as with group cuts) • Examine if edge effects differ depending on the cut size and landscape characteristics • Examine effects of re-entry and rotation times foe even and un—even aged timber harvests • Simulate random landscapes to more precisely determine effects of size and shape on abundance • Time to recovery including edge effects • Estimate edge effects for additional species and ecotones • R package or automated system for land managers to apply this to a various harvest plans Acknowledgments We thank S. Callahan, T. Luther, K. Starke, S. Fay, C. Costello, M. Medeiros, and J. Sweeney, M. Baber, J. Clancy, A. Shutt, E. Baldwin, M. Libby, M. Cole, C. Meaney, G. Barr, H. Givens, M. Tarr, T. Tarr for help on various aspects of this project. Special thanks to W. Peterman for GIS help. The USDA Forest Service and University of New Hampshire Cooperative Extension provided funding for this research project.